

SUBJECT
Insights
Weeksly insights offered by Powdertechnology.info powdered by Delft Solids Solutions
PUBLICATIONS
Browse publications
Explore PTI articles, Insights, Know How, and technical publications related to this subject.
 10 October 2026
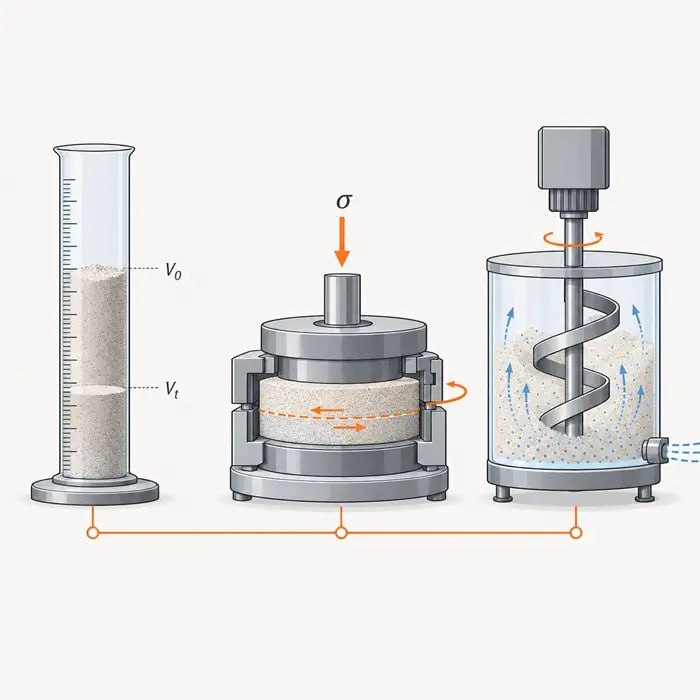
PBF Powder Flowability Testing: Why Different Methods Disagree and What the Results Mean
Hausner ratio, shear cell, and dynamic flow energy results on the same PBF powder lot rarely agree exactly. That disagreement is a decision input, not proof that a method or lab got it wrong.
Insights
 3 October 2026
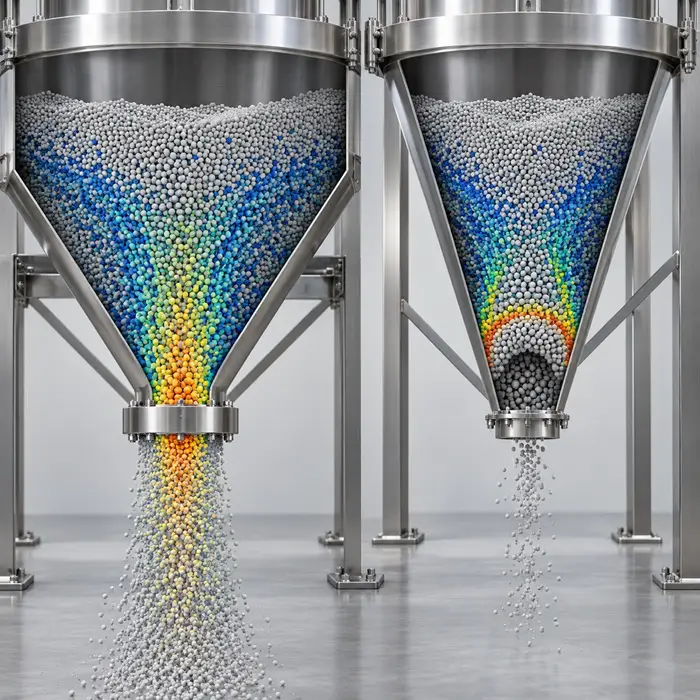
DEM Calibration: Why a Model That Reproduces One Bulk Test Can Still Fail in a Different Hopper Geometry
DEM input parameters are fitted to match a bulk observable, not derived from first principles. A parameter set calibrated against an angle of repose test constrains one point in a multi-dimensional parameter space. When the hopper geometry changes, the stress state changes, and unconstrained parameters become the dominant source of prediction error.
Insights
 26 September 2026
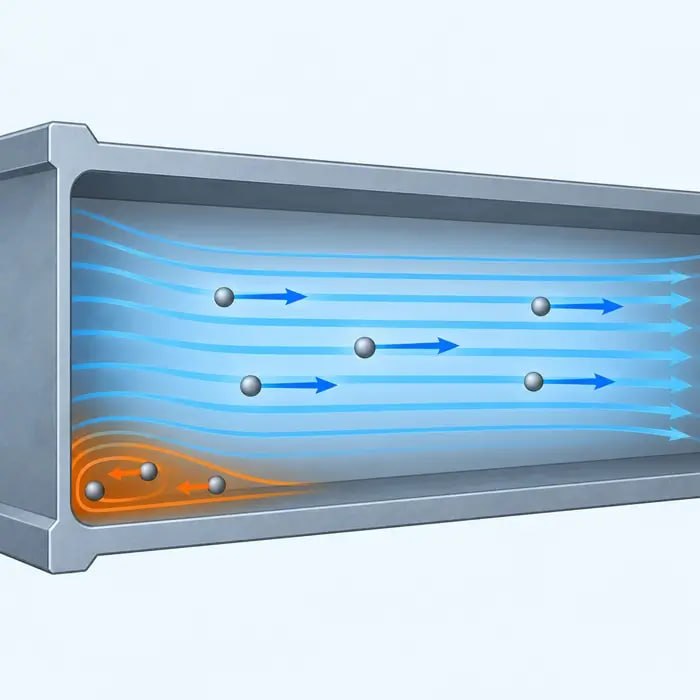
Triboelectric Particle Back-Flow in Pneumatic Conveying: Why Charged Particles Migrate Upstream at Duct Corners
CFD-DEM simulations show triboelectrically charged particles can reverse direction in low-drag duct corner zones during pneumatic conveying, with the delay between feed pulses driving the effect more than pulse length.
Insights
 19 September 2026
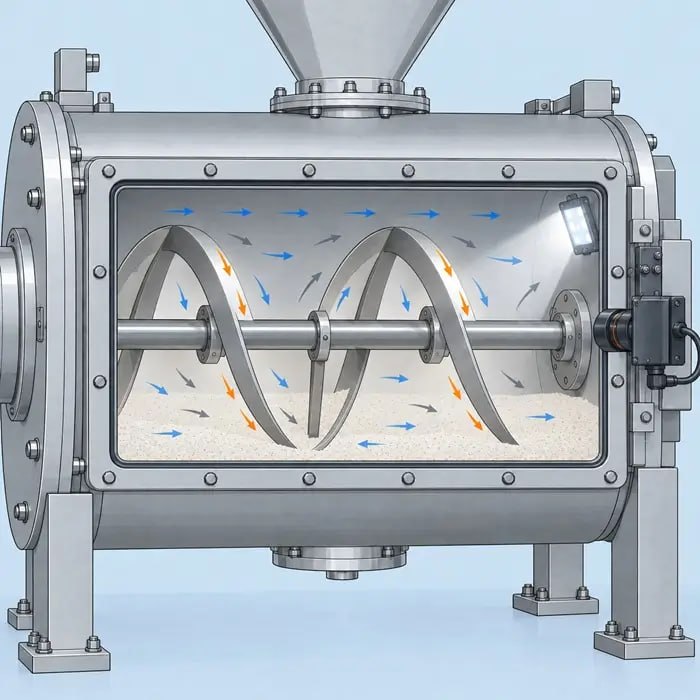
Real-Time Powder Flow Imaging: What LED-Based Particle Image Velocimetry Adds Beyond Static Flowability Tests
LED-based particle image velocimetry (PIV) images the velocity field inside a moving powder bed during blending, adding spatial resolution that static angle of repose, Hausner ratio, and shear cell tests cannot provide. Here is what that resolution can and cannot support for a process decision.
Insights
 12 September 2026
Powder-Fed Laser Cladding: Why Stable Feed Rate Does Not Guarantee Stable Deposition
In powder-fed laser cladding, a stable feeder setpoint and an in-spec particle size distribution do not guarantee a stable deposit. Catchment efficiency and stream divergence sit between the feeder and the melt pool, and both can drift independently of the powder's PSD.
Insights
 5 September 2026
High-Shear Wet Granulation Endpoint Detection: What Power Consumption Signals Actually Tell You
The power or torque trace in high-shear wet granulation rises and plateaus as granules consolidate, but the signal is a supporting process indicator, not a direct particle size measurement, and its interpretation is bounded by batch size, impeller geometry, and formulation.
Insights
 29 August 2026
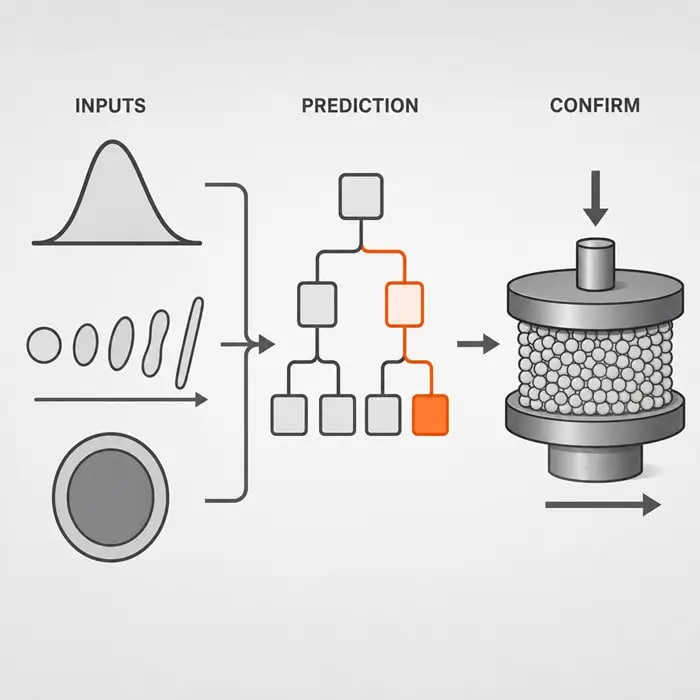
Machine Learning Flowability Prediction: What Constituent-Property Models Can and Can’t Replace
A Pharmaceutical Research study trained Random Forest and XGBoost classifiers on particle size, shape, surface energy, and silica dry-coating data to predict powder blend flowability category. The accuracy holds up as a screening tool and breaks down in specific, predictable places.
Insights
 22 August 2026
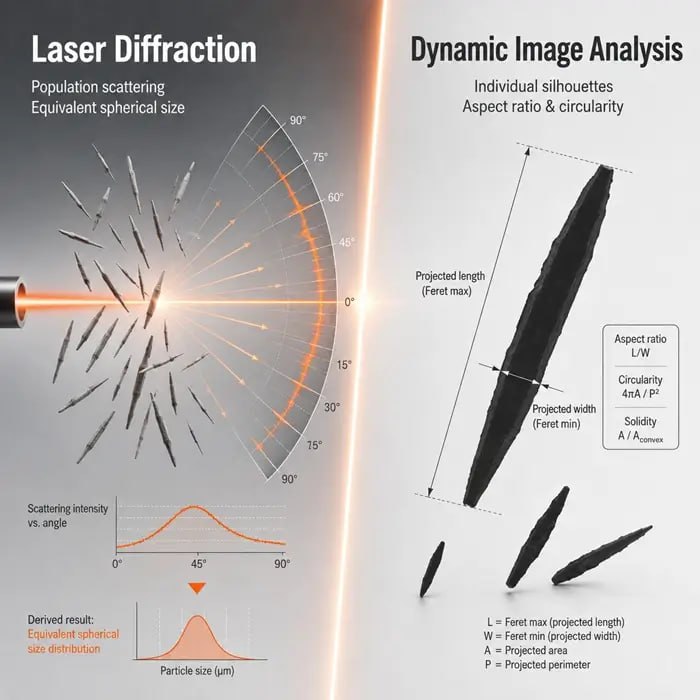
When Laser Diffraction and Dynamic Image Analysis Are Run Together: What Combined PSD-Shape Workflows Add to Interpretation
Pairing laser diffraction with dynamic image analysis adds per-particle shape descriptors, aspect ratio, circularity, convexity, that help explain an anomalous D50 or D90 and show where the combined result still cannot replace a dedicated particle morphology study.
Insights
 15 August 2026
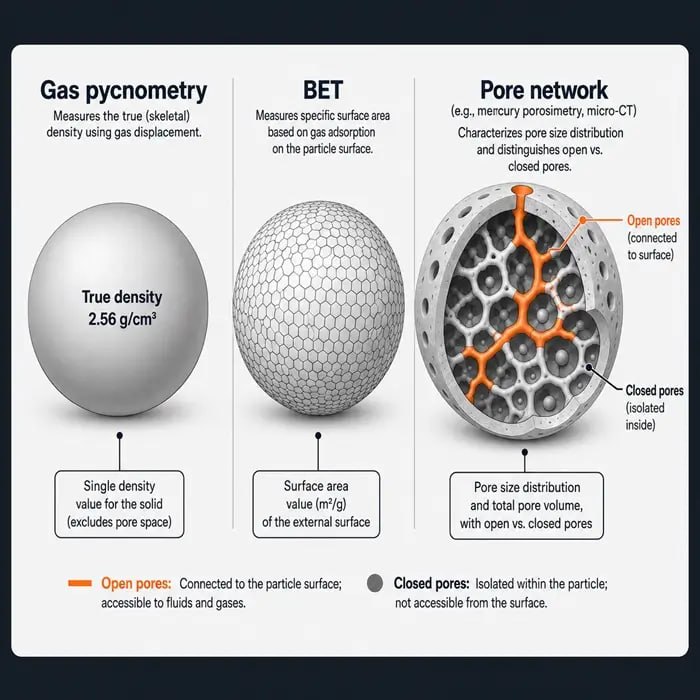
X-ray Micro-CT for Powder Pore Networks: What It Adds Beyond Gas Pycnometry and BET Surface Area
Gas pycnometry and BET surface area each report a single number. X-ray micro-CT builds a three-dimensional map of the pore network, showing connectivity, tortuosity, and closed porosity that single-value tests cannot resolve, within real resolution and sample-size limits.
Insights
 8 August 2026
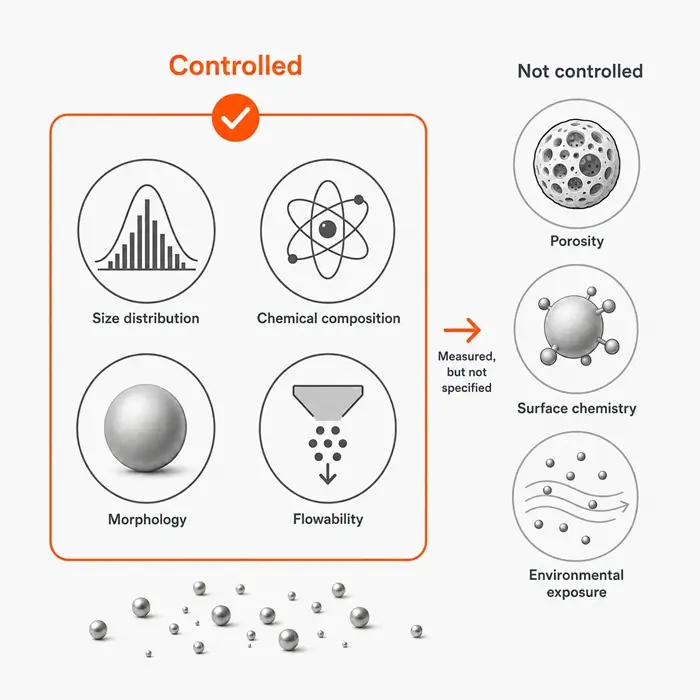
SAE AIR7359: Why Some Metal Powder Feedstock Properties Are Left Out of AM Specifications
AIR7359 explains why AMS-AM metal powder feedstock specifications leave certain properties uncontrolled, citing limited applicability and immature standardized inspection methods, and what that gap means for aerospace AM qualification programs.
Insights
 1 August 2026
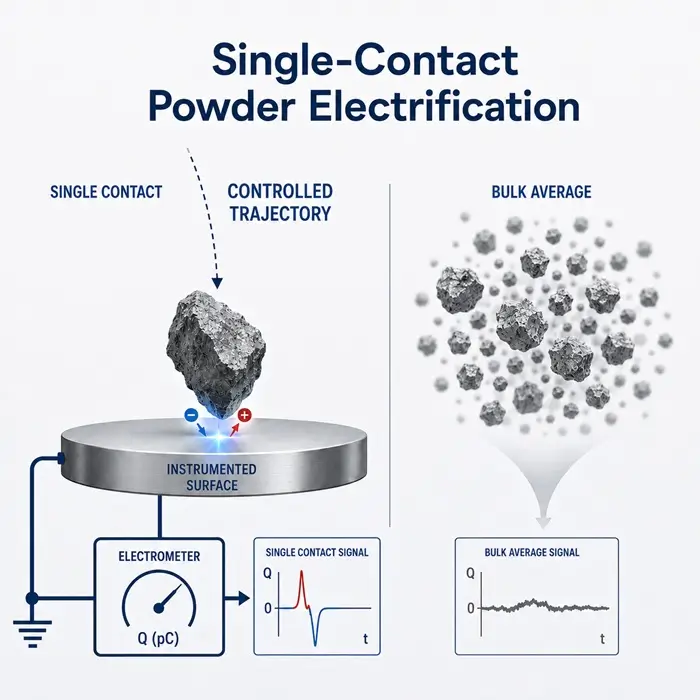
Single-Contact Electrification Testing: Isolating Charge Transfer Per Contact
Single-contact electrification apparatus measures charge transfer from one controlled particle-surface or particle-particle contact, isolating a variable that bulk triboelectric and charge decay measurements can only report as an average.
Insights
 25 July 2026
Roller Compaction Ribbon Solid Fraction: Why the Same Roll Force Can Produce Different Granules
Two lots that pass the same incoming flowability spec can still granulate differently after roller compaction. The reason usually traces to ribbon density, which responds to roll force, gap width, and feed screw speed as an interacting set, not to roll pressure in isolation.
Insights