
🔑 Key Takeaway
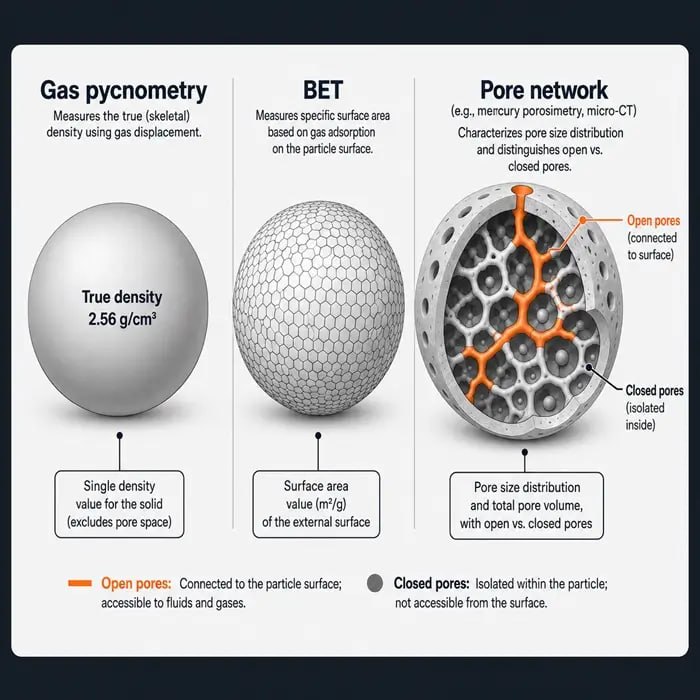
Gas pycnometry reports a single skeletal density value, and BET surface area reports a single specific surface area value, but neither shows how pore space is arranged inside a powder particle. X-ray micro-CT builds a three-dimensional map of the pore network, distinguishing pores connected to the particle surface from pores sealed inside it, and calculating tortuosity along the connected pathways. Its resolution and the small sample volume it can practically scan set real limits on when that extra detail actually changes a process decision.
Two lots of the same powder can return matching gas pycnometry density and matching BET surface area, then behave differently once they reach a sintering furnace, a dissolution vessel, or a fluidized bed. When that happens, the two single-value tests have already told the engineer everything they can tell about that difference.
The next question is not simply whether porosity is present, but whether its internal arrangement could explain the process behaviour that the bulk measurements cannot resolve. That is where a spatial technique becomes useful: not as a more sophisticated replacement for established measurements, but as a way to investigate a specific structural hypothesis raised by the process result.
X-ray micro-CT does not replace pycnometry or BET. It adds a spatial map of the pore network that neither test can provide, bounded by resolution limits and small scan volumes that need to be understood before the images are used to justify a process decision. Used within a broader powder characterization strategy, it can show whether an aggregate measurement is hiding a structural difference that matters to processing or performance.
What Gas Pycnometry and BET Actually Report
Gas pycnometry determines skeletal volume from the gas displaced by a sample at controlled pressure, usually using helium, and converts that into skeletal density. Gas can enter accessible pore space, but not a fully sealed pore. Closed pore volume therefore remains included in the measured skeletal volume, so pycnometry cannot distinguish whether a density difference originates from closed porosity or from another change in material composition or structure.
BET surface area comes from a gas adsorption isotherm and returns one aggregate value for specific surface area across the whole sample. BET analysis responds to surface the adsorbing gas can reach within the measurement timescale, but it collapses that response into a single number. A particle with a few large open pores and one with a dense network of narrow interconnected pores can report similar BET values while behaving very differently once fluid has to move through them.
What a 3D Pore Network Adds Beyond Single-Value Tests
X-ray micro-CT reconstructs a three-dimensional volume from x-ray projections taken as the sample rotates, then segments the reconstructed voxels into solid and void space. Because the reconstruction keeps spatial position, the pore network can be separated into open porosity, voids connected to the particle’s exterior, and closed porosity, voids fully enclosed within the solid. Work on additively manufactured parts uses this distinction directly, since closed pores behave differently from open ones once a part carries load or contacts a process fluid.
From the same segmented network, geometric tortuosity can be calculated from the length of connected pathways relative to the corresponding straight-line distance. Tortuosity calculations on percolating pore networks from micro-CT data show that two samples with similar total porosity can differ in tortuosity, which affects how quickly gas or liquid moves through the material. Tortuosity from micro-CT is a supporting indicator for permeability and diffusion-limited behavior, not a full permeability prediction by itself, since it does not capture pore-wall roughness below the imaging resolution or fluid-specific interactions.
Where Resolution and Sample Volume Bound the Method
Every micro-CT scan trades spatial resolution against field of view: a smaller voxel size resolves finer pore features but shrinks the physical volume that fits in the detector’s field of view at that resolution. Work on this resolution-versus-volume trade-off in micro-CT of porous media reports that pore features near or below the voxel dimension are underestimated or missed, and that coarser resolution systematically understates porosity while overstating connectivity-dependent properties. The same constraint applies to powder particles imaged on lab-based micro-CT systems.
The volume scanned at a resolution fine enough to resolve narrow pore necks is often a small fraction of a production lot, sometimes a handful of particles. That raises the same representativeness question that applies to any localized measurement. Sampling representativeness needs to be established for micro-CT results the same way it does for other characterization methods, before those results support a lot-wide process decision.
When the 3D View Changes a Process Decision
In metal powder feedstock for additive manufacturing, closed porosity within gas-atomized particles can survive processing and contribute to porosity in the finished part, with potential consequences for fatigue performance. Routine feedstock specifications and bulk properties such as density and flow do not necessarily reveal whether porosity is open to the particle surface or sealed internally, while assessments of feedstock quality increasingly need to consider these internal features. In dissolution-sensitive applications, the wetted internal surface available to a fluid similarly depends on whether pores are open and interconnected rather than closed, so surface contact and dissolution behaviour can differ between materials with similar BET surface areas. Micro-CT can directly examine this internal connectivity and distinguish open from closed pore space, providing a structural explanation that can then be tested against the relevant process response.
Practical Interpretation Checklist
Before commissioning a micro-CT scan to explain a pycnometry or BET discrepancy, confirm the suspected pore or feature size is meaningfully larger than the resolution available on the scanning system, since sub-resolution features will not appear in the result. Decide whether the suspected problem points to open porosity, closed porosity, or tortuosity, since each points to a different follow-up test. Treat the scanned volume as a sample, not the lot, and scan enough particles or replicates to support the claim. Pair the result with the property it is meant to explain, such as permeability or dissolution rate, and keep pycnometry and BET in the routine QC panel rather than replacing them.