
Table of contents

The Hausner Ratio and Carr Index appear in pharmacopeial standards, incoming QC routines, and supplier specifications across virtually every powder-handling industry. They are fast to measure, require no specialized equipment beyond a graduated cylinder and a tap density tester, and produce a single number that can be trended, specified, and compared across batches. This combination of simplicity and apparent precision makes them attractive as a primary flow screening tool.
The difficulty is that both indices derive from exactly the same two measurements, bulk density and tapped density, and carry no information about the physical mechanism that produced the result. A compressibility index of 28% arising from a highly aerated spray-dried excipient, from an irregular-shaped mineral filler, and from a cohesive fine API are indistinguishable by the number alone. These three materials will behave differently in a hopper, a feeder, and a blender, and the process response that addresses each problem differs. Knowing the number without knowing the mechanism is knowing less than the number implies.
What the Hausner Ratio and Carr Index Actually Measure
The Hausner Ratio (HR) divides tapped density by bulk density. The Carr Index (CI), also called the compressibility index, expresses the same relationship as a percentage: CI = ((tapped density minus bulk density) / tapped density) multiplied by 100. The two are mathematically interconvertible: HR = 100 / (100 minus CI). A Hausner Ratio of 1.25 corresponds to a Carr Index of 20%. A Hausner Ratio of 1.40 corresponds to a Carr Index of approximately 28.6%.
The measurement procedure specifies how bulk density is obtained, typically by carefully filling a graduated cylinder under standardized pouring conditions, and how tapped density is measured after a specified number of taps at a standardized drop height and frequency. ASTM D7481 defines procedures for loose and tapped bulk densities of powders using a graduated cylinder. The USP chapter 1174 on Powder Flow provides an equivalent harmonized method and includes the flow classification table applied across pharmaceutical QC globally.
The tapping step provides mechanical energy that enables particles to rearrange into lower-energy packing configurations. Each tap cycle briefly separates contacting particles, and gravity returns them to a denser arrangement. The ratio between initial and final densities captures how much rearrangement occurred, but it does not record what resisted that rearrangement, what enabled it, or whether the starting packing state was representative of the process condition. Bulk density measurement is sensitive to how a sample was prepared and poured, and that sensitivity propagates directly into both indices.
The Flow Classification Table and Its Limits as a Decision Tool
The classification most widely applied to Hausner and Carr results traces to empirical work by Carr published in 1965, reproduced in USP chapter 1174 Powder Flow as Table 2. The table assigns descriptors from excellent to very very poor based on CI or HR ranges. A Carr Index of 10% or below and a corresponding Hausner Ratio at or below approximately 1.11 fall in the excellent category. Values above approximately 38% CI or 1.60 HR indicate very very poor flow. These thresholds were developed empirically for pharmaceutical powders, and the original dataset was narrow by the standards of modern industrial materials.
The table serves two legitimate functions. It provides a shared vocabulary for comparing results across batches, suppliers, or sites when the material class is consistent. It also supports a first-pass flag: a material that consistently falls in the poor or very poor range, or that drifts upward from its established baseline, warrants investigation before process equipment is specified. What the table cannot provide is any explanation of why the number falls where it does.
Applying the pharmaceutical classification ranges to metal powders for additive manufacturing, mineral fillers, or food ingredients without critical evaluation is not technically supported. The mechanisms at work in those material classes differ from pharmaceutical granules and APIs, and the empirical calibration of the original scale does not transfer automatically. The classification is a starting point for structured investigation, not a universal flowability metric.
Three Physical Mechanisms That Produce the Same Ratio
Consider three powders, each with a Hausner Ratio of 1.35 and a Carr Index of approximately 26%. The first is a spray-dried dairy excipient with low particle density and high interparticle void space in its freshly filled state. The second is a milled mineral filler with irregular, elongated particles. The third is a cohesive fine API with a significant sub-50-micron fines fraction. The number is identical across all three. The physical mechanism is different in each case, and the process response that addresses a problem in one will not address the same value in another.
Aeration State and Initial Packing Geometry
Some powders are loaded into a graduated cylinder in an air-entrained state that bears little relationship to their condition in a process vessel. Spray-dried particles, freeze-dried agglomerates, and light fluffy materials have an initial bulk density far below their equilibrium packed density. Each tap cycle drives trapped air from the interparticle void space, and the settled volume decreases sharply. The resulting Hausner Ratio is high, but the driving mechanism is aeration, not cohesion.
In practice, the same powder may arrive at a process feeder inlet already partially deaerated from transport, conveying, or the pressure of material above it in the vessel. The relevant density for process design is the bulk density the powder exhibits under actual process conditions, not the poured density from a lab filling step. Powder deaeration behavior and air retention time determine how this transition happens in real handling systems, and a high Hausner Ratio driven by aeration alone can significantly overstate the practical processing difficulty.
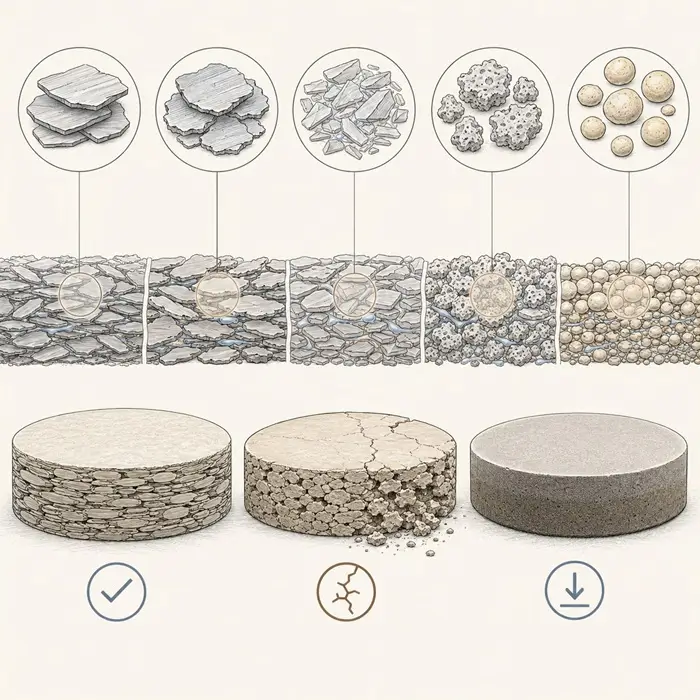
Particle Shape and Geometric Packing Constraints
Irregular, elongated, or platy particles cannot fill available volume efficiently, regardless of interparticle surface energy. The void fraction at any packing state is geometrically constrained by particle shape. Tapping reduces this void fraction somewhat because particles can reorient slightly and interlock differently, but the efficiency ceiling is much lower than for spherical or near-spherical particles. A Hausner Ratio elevated by shape-constrained packing does not imply cohesion.
Shape-related Hausner Ratio values do not predict arching or ratholing in the same way that cohesion-driven values do. A powder with irregular particles and an HR of 1.35 may mass-flow without blockage from a suitably designed hopper outlet, while a cohesive fine powder at the same HR may arch across outlets several times larger than standard flow function calculations would indicate. Distinguishing between these two cases requires particle size analysis, shape imaging, or a shear cell measurement.
Cohesion, Fines, and Surface Force Effects
Fine particles in the sub-100-micron range interact through van der Waals forces, electrostatic attraction, and, under humid conditions, capillary bridges formed at particle contact points. These forces resist the rearrangement that tapping attempts to drive. The resulting compaction is incomplete, sensitive to consolidation history, and responsive to moisture content. A Hausner Ratio elevated by cohesion is the mechanism most directly associated with arching, ratholing, and erratic feeder discharge in production systems.
Fines content has a disproportionate effect on cohesive behavior because fines carry high surface area per unit mass and can coat coarser particles, building contact networks that span the powder bed. A modest increase in the sub-50-micron fraction, well below what laser diffraction might flag as a significant PSD shift, can drive a measurable increase in Hausner Ratio without any corresponding change in the coarse fraction. This effect is amplified at elevated relative humidity. Research on the consistency of the Hausner Ratio as a flowability indicator confirms that results vary with consolidation stress and powder system in ways that a single ratio value cannot reveal.
Process Decisions These Indices Can Reliably Support
Batch-to-batch consistency checking is the most reliable application of HR and CI. For a defined material from a consistent manufacturing process, a shift in either index often signals a change worth investigating: a different particle size from a milling step, moisture uptake during storage, or a raw material change from a supplier. The index itself does not identify the cause, but a trending value outside the established range is a reliable trigger for further testing.
Incoming material screening is valid when the index forms part of a broader quality panel rather than a standalone pass/fail gate. A material consistently within its expected HR and CI range across batches provides baseline confidence. A result outside the established range justifies holding the lot and running additional characterization before releasing to the process. For incoming QC, HR and CI work best when their reference ranges have been established against the same material across multiple batches.
Initial specification development benefits from HR and CI as fast, low-cost additions to a powder quality fingerprint. Together with particle size distribution, bulk density, and moisture content, they help characterize a material before process equipment is selected and provide a quick comparison when evaluating candidate raw materials or excipients from different suppliers. A substantially different HR between two nominally identical materials is a signal worth following, though the number itself does not explain what changed.
As a blend uniformity risk indicator, a large difference in HR between co-blended components can suggest different packing densities and packing behavior that may affect distribution uniformity during filling or mixing. This is a risk flag only, not a confirmation of blend failure. Segregation mechanism, particle size ratio, and blend intensity all govern the actual outcome more directly than density indices on individual ingredients.
Five Conditions Where Hausner Ratio and Carr Index Actively Mislead
Applying Hausner Ratio or Carr Index results directly to equipment sizing, process design, or segregation prediction without supplementary data creates a real risk of incorrect decisions. These are the five conditions where the number most reliably points in the wrong direction.
Feeder Type and Feeder Parameter Selection
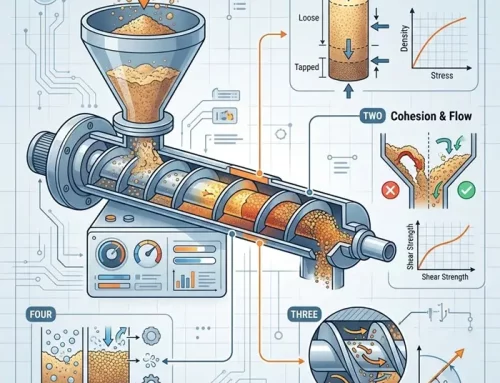
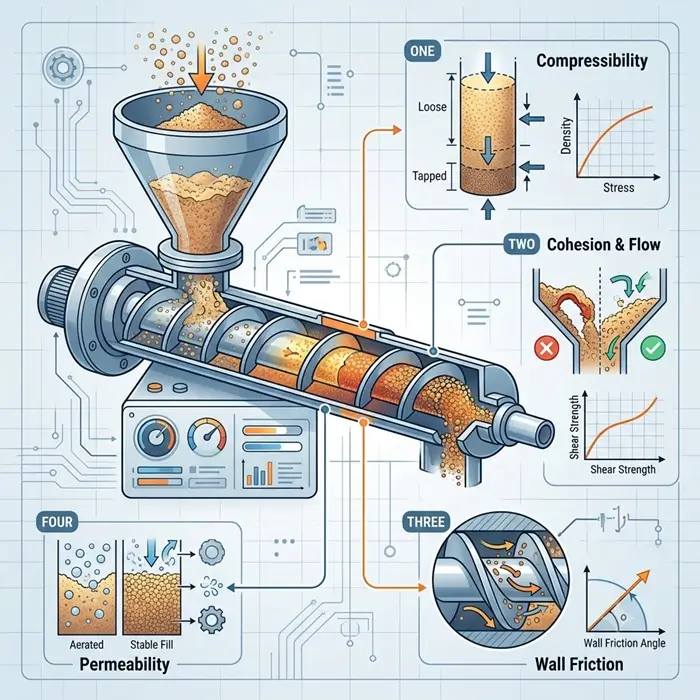
Feeder selection depends on how a powder responds to the stress history imposed by the equipment: the pressure of the powder head above the screw, the action of a vibrating tray, or the gate cycle of a loss-in-weight system. The relevant parameters are the flow function (unconfined yield strength as a function of major consolidation stress), permeability under applied load, and wall friction against the feeder surface. None of these are captured by HR or CI. Selecting the right feeder type requires characterization data that density indices cannot provide.
Powder permeability is particularly relevant for powders that contain fine material: a low-permeability powder cannot release interstitial air quickly enough to allow steady consistent flow under imposed stress. A feeder that performs reliably for a permeable powder of similar Hausner Ratio may behave erratically with a low-permeability material. The HR value is identical; the feeder response is not.
Hopper Outlet Sizing and Mass Flow Angle Calculation
Hopper design parameters, specifically the minimum outlet dimension needed to prevent arching and the cone half-angle required to maintain mass flow, are calculated from shear cell data and wall friction measurements. The flow function defines how much unconfined yield strength the powder develops under consolidation at any given consolidation stress, and the critical arching dimension follows from that relationship. The wall friction angle against the specific wall material determines whether the chosen cone angle produces mass flow or funnel flow.
A powder with an HR of 1.40 might mass-flow reliably from a correctly designed polished stainless steel cone, or arch persistently in a carbon steel vessel with a shallower angle, depending on its wall friction coefficient. HR carries no information about wall interaction. Wall friction and hopper geometry must be characterized directly. Using density ratios as a proxy for hopper design input has produced undersized outlets and incorrect mass flow conditions. Shear cell testing is the required characterization route for bin and hopper design.
Segregation and Blend Uniformity Risk Assessment
Segregation between blend components is driven by differences in particle size, density, shape, and surface energy, combined with the specific mechanisms of relative motion available during blending, transfer, or filling. The dominant segregation mechanism, whether trajectory, fluidization, percolation, or vibration-driven, depends on the combination of particle properties in the actual blend, not on the individual HR of a single component.
A high HR on one ingredient says nothing about whether it will segregate from a co-ingredient with a different particle size distribution and a similar HR. Segregation diagnosis during mixing, conveying, and filling requires testing that interrogates the blend composition directly, not density indices on individual components. Applying HR as a segregation risk tool without additional data generates unreliable conclusions in either direction.
Aerated Powders Characterized in Their Lab-Poured State
For highly aerated materials, the bulk density obtained in a lab-poured state can represent a condition that never occurs in the process. A spray-dried powder gently poured into a test cylinder at minimum bulk density will produce a high Hausner Ratio, but the same powder arriving at a feeder inlet after conveying, vibration in a bulk bag, or loading under its own weight in a silo may already be at a density closer to its tapped value. The relevant process bulk density is the density the powder exhibits under the mechanical history the process imposes, not the gently poured lab value.
Acting on a high HR from an aerated powder by oversizing a hopper outlet, for example, can create a different operational problem: a correctly flowing powder that feeds inconsistently at low fill levels because the outlet is too large for the available flow rate. Deaeration rate and air retention are the parameters that matter for aerated powders, and both require separate measurement.
Sample History and Pre-Test Conditioning Effects on the Result
The bulk density measurement that feeds into both indices is sensitive to how the powder was handled before the test cylinder was filled. A sample compressed in a bulk bag, vibrated during transport, or settled under its own weight in a storage container will produce a higher initial bulk density than freshly produced material. The resulting HR will be lower, not because the powder flows better, but because the starting packing state already reflects compaction that tapping has little additional room to produce.
Most routine QC procedures do not document sample history in detail. When a result shifts between batches, the shift may reflect a real change in the powder or a difference in how samples were collected, stored, and prepared before testing. Research on the accuracy of Hausner Ratio and Carr Index in additive manufacturing powder systems found that results vary with test conditions and sample preparation in ways that are not visible in the final number. Before acting on a trend, confirming that sample handling was consistent across the compared batches is a necessary step.
A Diagnostic Checklist Before Acting on a Hausner Ratio or Carr Index Result
These questions should be answered before a Hausner Ratio or Carr Index result is used to support a process decision. They are parallel checks, not sequential steps. Together they determine whether the number is sufficient for the decision at hand or whether a follow-on test is required.
Is this a change from an established baseline, or a first measurement on a new material? A shift from baseline is more informative than an isolated value because it indicates something has changed. A first measurement on a new material should be contextualized against a broader test panel before it is used to specify equipment or reject a lot.
What is the documented sample history? Has the test sample been transported, vibrated, pre-compacted, or stored in a way that differs from other samples in the comparison? Undocumented handling differences can explain apparent batch-to-batch variation that has no relationship to the powder itself.
Is the material known to be highly aerated in its freshly produced state? Spray-dried materials, freeze-dried products, and light agglomerates require separate assessment of their deaeration rate and process bulk density before a high HR result can be connected to real processing difficulty.
Is particle size distribution data available, and does it resolve the fines fraction? A significant sub-50-micron fraction often drives cohesion-related compaction and points toward corrective options that differ from those for aeration or shape effects. Selecting the appropriate powder flow test method for a cohesive fine powder leads to a shear cell, not a density ratio.
Is the downstream decision about hopper geometry, feeder type, or outlet sizing? If yes, HR and CI are insufficient input. Shear cell testing and wall friction measurement are required. Using density indices as a substitute for flow function data in equipment design is a documented source of undersized outlets and incorrect mass flow conditions.
Has a shear cell measurement been run on the same lot? If yes, the flow function and cohesion data from that test can be used to interpret what mechanism the density ratio reflects. If not, the mechanism is unknown, and the index should be treated as a screening flag rather than a design input.
Downloadable Reference: Hausner Ratio and Carr Index Interpretation Guide
The downloadable PDF accompanying this article is a practical interpretation guide designed for use in QC laboratories and bulk solids handling environments. It includes the Carr Index and Hausner Ratio classification table, a worked calculation example, a pre-interpretation check for measurement and sample history, a six-mechanism triage matrix, and a decision table that connects common process questions to the next required measurement.
The guide is structured as a working reference, not a summary of the article. It assumes the reader already has an HR or CI result and needs to determine what that result can support, which physical mechanisms remain plausible, what evidence argues for or against them, and what should be measured next. The mechanism triage matrix is the core of the guide: rather than assigning a physical explanation from the index range alone, it compares observations, supporting evidence, contradictory evidence, and follow-on tests across aeration, packing geometry, cohesion, surface-force effects, and sample-history influences.
Sources
- ASTM D7481, Standard Test Methods for Determining Loose and Tapped Bulk Densities of Powders Using a Graduated Cylinder, ASTM International.
https://www.astm.org/d7481-18.html - USP General Chapter <1174> Powder Flow, United States Pharmacopeia. Official harmonized text, Stage 4, effective May 1, 2024 (shown with revision markup):
https://www.usp.org/sites/default/files/usp/document/harmonization/gen-chapter/20230428HSm99885.pdf
Preview/landing page: https://doi.usp.org/USPNF/USPNF_M99885_01_01.html - Carr, R.L. (1965). “Evaluating Flow Properties of Solids.” Chemical Engineering, 72(2), 163–168.
https://www.semanticscholar.org/paper/EVALUATING-FLOW-PROPERTIES-OF-SOLIDS-Carr/09d1de3f90a3ce6c4f45e3cbd1258ba92e8570f4 - Saker, A., Cares-Pacheco, M-G., Marchal, P., Falk, V. (2019). “Powders flowability assessment in granular compaction: What about the consistency of Hausner ratio?” Powder Technology, 354, 52–63. https://doi.org/10.1016/j.powtec.2019.05.032
https://www.sciencedirect.com/science/article/abs/pii/S0032591019303729 - Kaleem, M.A., Alam, M.Z., Khan, M., Jaffery, S.H.I., Rashid, B. (2020). “An experimental investigation on accuracy of Hausner Ratio and Carr Index of powders in additive manufacturing processes.” Metal Powder Report, 76.
https://www.sciencedirect.com/science/article/abs/pii/S002606572030223X


