Updated: November 7, 2026
Table of contents

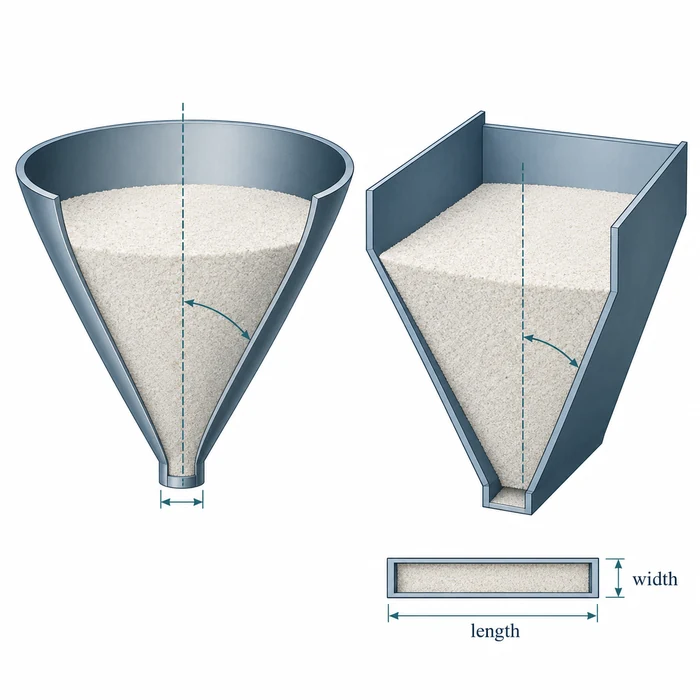
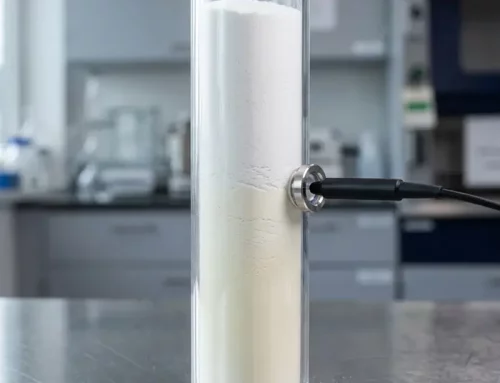
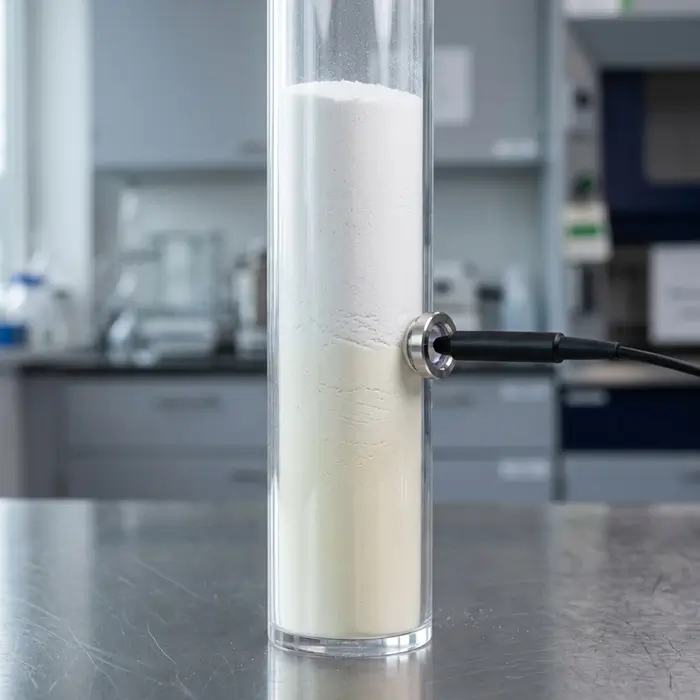
A hopper that discharges reliably when freshly filled may develop a stable arch after standing over the weekend. The powder has not changed composition, but its strength may have increased under the weight of the material above it. A flow test performed immediately after filling might miss that behavior.
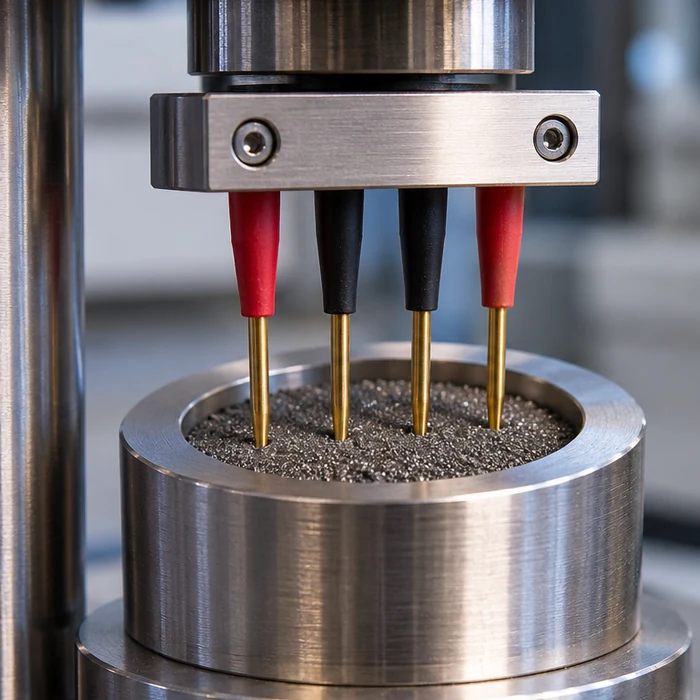
Shear cell testing helps engineers identify and quantify these differences. By measuring how a powder resists deformation under controlled stresses, it provides information for hopper design, material comparison, and troubleshooting.
From Guesswork to Engineering
Andrew Jenike’s 1964 Bulletin 123, Storage and Flow of Solids, established a systematic approach to measuring bulk-solid flow properties and designing bins and hoppers [1]. His work provided a basis for calculating conditions associated with stable arches, ratholes, and mass flow.
The Jenike shear cell and later developments made it possible to replace much of the trial and error in hopper design with measurements and calculations. However, the quality of a design still depends on selecting relevant test conditions and interpreting the results correctly.
What Shear Really Means
Shear occurs when one layer of particles moves relative to another. A powder’s resistance to that movement depends on interparticle adhesion, friction, particle size, shape, surface properties, and packing conditions [2].
When powder is consolidated, its particles develop a network of contacts that resists movement. Fine cohesive powders may develop substantial strength, while coarse, relatively noncohesive materials generally yield more readily.
The important distinction is that shear strength depends on the powder’s consolidation state. The same material may behave differently after filling, compaction, prolonged storage, or changes in humidity.
These relationships are explained further in PTI’s Shear Properties resource.
Why It Matters on the Line
Reliable discharge from bins and hoppers is essential in industrial processing. Flow stoppages caused by arching and ratholing can interrupt production, but poor flow behavior can produce other problems.
These include flooding, segregation, reduced usable storage capacity, caking in stagnant regions, and excessive or uneven structural loading [3].
Shear measurements provide the material properties needed to investigate several of these problems. When combined with wall friction measurements and appropriate design calculations, they help engineers establish hopper geometry that supports reliable gravity discharge.
However, measurements made at one consolidation condition cannot automatically represent every condition a powder experiences in production.
The Yield Locus, the Flow Function and ffc
These three terms describe related but different quantities.
Yield locus
A yield locus describes the shear stress required to cause failure at different normal stresses for one defined consolidation state.
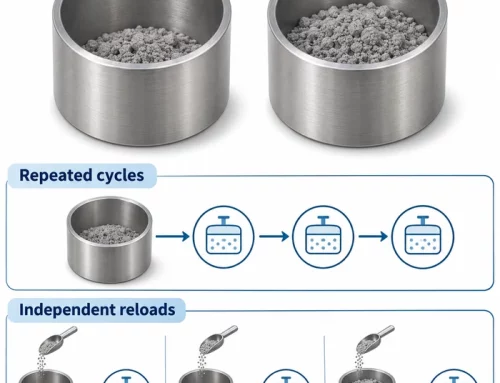
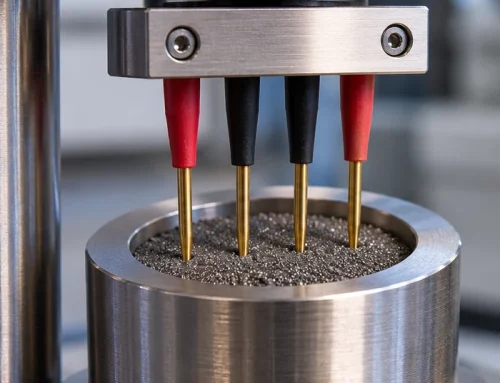
The tester first preshears the powder under a selected normal stress until steady-state shear is reached. The normal stress is then reduced, and the specimen is sheared until failure occurs.
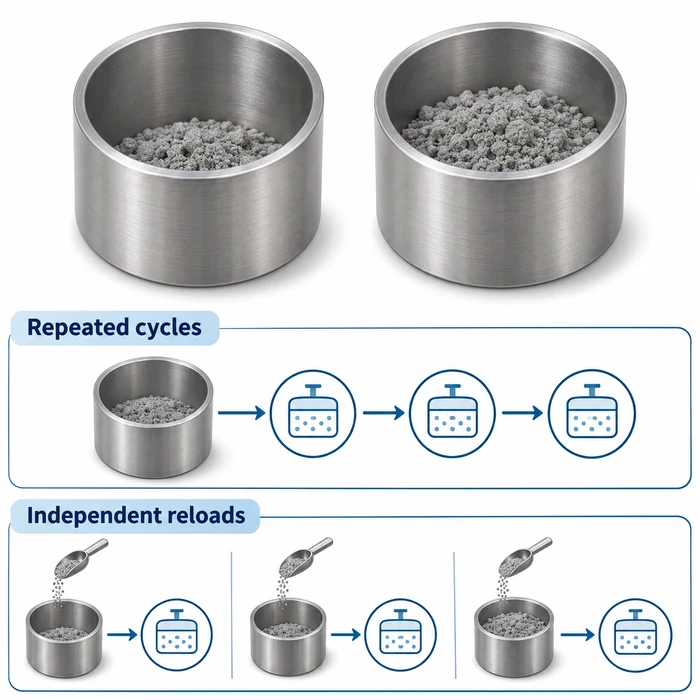
This preshear and failure sequence is repeated at several lower normal stresses. Depending on the instrument and procedure, the measurements may require fresh specimens or repeated conditioning of the same specimen. The resulting points define a yield locus [3, 4].
Flow function
A flow function requires measurements at several consolidation levels. From the yield loci, the major principal consolidation stress and corresponding unconfined yield strength are determined.
The flow function plots unconfined yield strength against major principal consolidation stress. It therefore describes how a powder’s strength changes as it experiences greater consolidation.
This relationship is particularly important for hopper design because the powder near an outlet may have experienced a very different consolidation history from material higher in the vessel.
Flow function coefficient
The flow function coefficient, written as ffc, is calculated at a particular consolidation stress:
ffc = σ₁ / fc
Where:
- σ₁ is the major principal consolidation stress.
- fc is the unconfined yield strength.
A higher ffc indicates easier flow under the specified conditions.
The commonly used classification is [5]:
| ffc | Flow behavior |
|---|---|
| Below 1 | Not flowing |
| 1 to 2 | Very cohesive |
| 2 to 4 | Cohesive |
| 4 to 10 | Easy flowing |
| Above 10 | Free flowing |
These ranges are useful for comparison, but ffc is not an intrinsic material constant. It can change with consolidation stress, preparation, and environmental conditions.
Consequently, compare ffc values at equivalent consolidation stresses using comparable test methods and cell configurations.
The material flow function coefficient ffc must not be confused with the hopper flow factor ff. The latter describes the stress relationship used in Jenike’s hopper outlet-design calculations and depends on the hopper geometry and friction properties.
The Methods and Their Standards
Several established shear-testing methods provide data for powder characterization and equipment design.
Jenike shear cell
ASTM D6128-22 covers shear testing with the Jenike shear tester. It provides procedures for determining properties such as cohesive strength, internal friction, bulk density, and wall friction [6].
The measurements support calculations for storage bins and hoppers, particularly when assessing arching, ratholing, and mass-flow requirements.
Schulze ring shear tester
ASTM D6773-22 covers testing with the Schulze ring shear tester. It provides measurements used to determine unconfined yield strength, internal friction, bulk density, and wall friction [3].
For materials with broad particle-size distributions, the standard notes that when approximately one-third or more of a bulk solid consists of particles smaller than 6 mm, the fine fraction generally governs its unconfined yield strength. In these circumstances, strength and wall friction measurements may be performed on that fraction.
This does not mean that all particles above 6 mm are irrelevant. The particle-size distribution and suitability of the selected test fraction must be considered.
FT4 powder rheometer shear cell
ASTM D7891-24 covers shear testing with the Freeman Technology FT4 powder rheometer shear cell [4].
The method provides properties including unconfined yield strength, internal friction angles, cohesion, major principal stress, flow function, and wall friction angle.
It is intended for powders with a maximum particle size of approximately 1 mm. A small proportion of larger particles may be acceptable, but for samples with approximately normal particle-size distributions, the standard recommends that particles at or above 1 mm represent no more than 5% of the sample mass.
The method can also support comparisons involving changes in humidity, moisture content, temperature, and particle size.
European silo design standards
In Europe, EN 1991-4:2026, Eurocode 1: Actions on Structures, Part 4: Silos and Tanks, provides rules for calculating structural actions on silos and tanks, including provisions relating to particulate-solid properties [7].
The first-generation EN 1991-4:2006 remains available during the coexistence period, with withdrawal scheduled for March 2028. Check the applicable edition and National Annex against national implementation requirements.
EN 1991-4 addresses structural actions. It does not replace the separate flow-property measurements and calculations needed to determine hopper outlet dimensions and mass-flow geometry.
What about uniaxial compaction testing?
Uniaxial compaction testers offer a simpler approach to powder strength measurement, but their results are not necessarily interchangeable with shear cell measurements. Parrella and colleagues compared five powders using a ring shear tester and a uniaxial compaction tester [8]. Differences in stress state meant the two methods did not always agree.
For more cohesive materials, wall friction in the uniaxial tester explained much of the discrepancy. Correcting for that effect produced substantial agreement for a calcium carbonate powder, but only at low consolidation levels for four food powders. The researchers also found that extrapolating uniaxial flow functions toward low consolidation stresses can underestimate cohesion.
A simpler method can therefore be useful for screening, provided its limitations are understood.
Cell Size Changes the Answer
Shear cell dimensions can influence measured flowability even when the same powder and testing principle are used. Wang and colleagues examined pharmaceutical powders and a reference limestone using three ring shear cell volumes: approximately 9.5, 30, and 70 cm³ [2]. The tests covered three preshear normal stresses.
The reference limestone produced relatively small differences between cells, but pharmaceutical powders showed more pronounced changes. For powders with median particle sizes above 22 µm, the measured ffc was more than 15% higher in the smallest cell than in the medium cell. Large differences between the medium and largest cells appeared for powders with median particle sizes above 125 µm.
These results make cell configuration an important consideration when comparing suppliers, formulations, or historical laboratory data. An apparent change in ffc may partly reflect the test equipment rather than the material itself.
Time at Rest and Humidity
Powder strength can increase while material remains consolidated during storage. This effect, known as time consolidation, depends on the material, stress, humidity, temperature, and storage duration.
Thool and colleagues examined six pharmaceutical excipients using ring shear testing under controlled storage conditions [9]. Three materials showed time consolidation to different extents. Citric acid and starch developed increased strength at 75% relative humidity, while mannitol showed time consolidation at both 50% and 75% relative humidity.
Given sufficient time, mannitol formed a cake with an ffc below 1. The study demonstrates that humidity sensitivity varies between materials, with some powders developing substantial strength even at moderate humidity.
For equipment that must restart after storage, request time-consolidated flow functions at conditions representative of the maximum expected standstill. An instantaneous flow function alone may underestimate the resistance encountered during restart.
What Shear Testing Does and Does Not Predict
When combined with wall friction data and appropriate design methods, shear measurements provide essential inputs for calculating hopper geometry and resistance to cohesive arching and ratholing.
For mass-flow design, engineers need effective internal friction and wall friction measured against the intended hopper surface. For cohesive arching calculations, the material flow function must be considered alongside the hopper flow factor, bulk density, and outlet geometry. The tested consolidation range must also cover the stresses relevant to the design, because extrapolation outside that range introduces uncertainty.
The limitations become apparent when operating conditions differ substantially from the laboratory stress state. Vasilenko and colleagues compared rotational shear cell measurements with a gravity-driven flow method for 14 pharmaceutical blends [10]. They found a significant correlation between the techniques, although shear cell cohesion correlated more strongly with the gravity-driven flow index than the flow function coefficient. Differences in consolidation state helped explain the discrepancies.
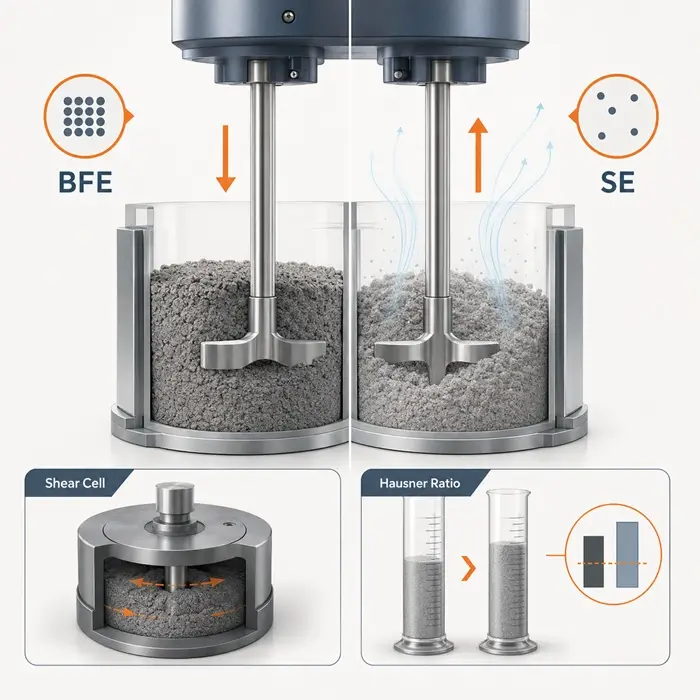
This matters because gravity-driven discharge, aeration, and vibration can produce powder behavior that conventional shear measurements do not fully represent. Clayton [11] describes how dynamic powder testing and bulk-property measurements can complement shear testing when investigating erratic hopper discharge. PTI’s Dynamic and Aerated Powder Testing article explains what flow energy measurements add when the operating powder bed is lightly confined, aerated, or dynamically disturbed.
Low-stress applications present another challenge. Stavrou and colleagues found that extrapolating higher-stress shear data into the low-stress region can overestimate unconfined yield strength [12]. Shear cells can investigate relatively low consolidation stresses, but reproducibility and relevance to the process must be established rather than assumed. For aerated, vibrated, or weakly consolidated powders, use complementary methods that reflect the operating conditions.
What You Can Do With the Results
A shear test report becomes useful when its measurements are connected to a defined engineering problem. For hopper design, combine the material flow function with effective internal friction, wall friction measured against the intended liner, bulk density under relevant conditions, and the proposed hopper geometry.
These measurements support two separate design decisions. First, determine whether the selected wall angles will support mass flow. Then calculate the outlet dimension required to prevent cohesive arching under the governing material condition. Ratholing, discharge capacity, and loaded restart require additional checks.
A high ffc does not guarantee reliable discharge from an unsuitable hopper. PTI’s Hopper Design Check Using Shear-Test Data provides a worked procedure for assessing outlet size and wall angle from shear measurements.
Where formulation changes are possible, flow aids such as colloidal silica may reduce cohesion under some conditions. Their effect depends on material properties and dosage, and they must be evaluated experimentally.
Good Practice
Always report the tester, shear cell dimensions, sample preparation procedure, preshear conditions, consolidation stress range, humidity, temperature, and storage time. Where hopper design is the objective, request the material flow function, effective internal friction, wall friction against representative wall coupons, and bulk density data.
Retain the underlying measurements rather than relying on a single reported ffc. Repeat measurements to evaluate variability, and include time-consolidation tests if the material will remain in storage. Compare results only when the test conditions and methods are sufficiently similar.
For a broader comparison of measurement techniques, see PTI’s Guide to Powder Flow and Flowability Testing. The article on Selecting and Comparing Powder Flow Test Methods provides further guidance on matching the measurement to the process problem.
Conclusion
Shear cell testing provides a quantitative foundation for hopper design and powder-flow troubleshooting. Its value lies in measuring how material strength changes with consolidation and in supplying friction and strength data for engineering calculations.
A single ffc value cannot describe every operating condition. Cell size, storage history, environmental conditions, and stress range all influence the result.
For hopper design, obtain the complete set of relevant shear and wall friction measurements, apply the appropriate geometry calculations, and check the result against actual operating conditions. Where aeration, vibration, or low-stress behavior governs performance, complementary testing is necessary.
Frequently asked questions
References
- Jenike AW. Storage and Flow of Solids. Bulletin 123, Utah Engineering Experiment Station, University of Utah, 1964. Source
- Wang C, Song S, Gunawardana CA, Sun DJ, Sun CC. Effects of shear cell size on flowability of powders measured using a ring shear tester. Powder Technology. 2022;396:555-564. DOI
- ASTM International. ASTM D6773-22: Standard Test Method for Bulk Solids Using Schulze Ring Shear Tester. Standard
- ASTM International. ASTM D7891-24: Standard Test Method for Shear Testing of Powders Using the Freeman Technology FT4 Powder Rheometer Shear Cell. Standard
- Schulze D. Flow Properties of Powders and Bulk Solids. Technical paper. Source
- ASTM International. ASTM D6128-22: Standard Test Method for Shear Testing of Bulk Solids Using the Jenike Shear Tester. Standard
- European Committee for Standardization. EN 1991-4:2026: Eurocode 1, Actions on Structures, Part 4: Silos and Tanks. NEN edition
- Parrella L, Barletta D, Boerefijn R, Poletto M. Comparison between a Uniaxial Compaction Tester and a Shear Tester for the Characterization of Powder Flowability. KONA Powder and Particle Journal. 2008;26:178-189. DOI
- Thool P, Stancill C, Bui M, Mao C. Evaluation of Time Consolidation Effect of Pharmaceutical Powders. Pharmaceutical Research. 2022;39:3345-3357. DOI
- Vasilenko A, Glasser BJ, Muzzio FJ. Shear and flow behavior of pharmaceutical blends: Method comparison study. Powder Technology. 2011;208(3):628-636. DOI
- Clayton J. Best Practices for Optimizing Hopper Performance. Equipment and Processing Report. Issue 13, November 18, 2015. Source
- Stavrou AG, Hare C, Hassanpour A, Wu CY. Investigation of powder flowability at low stresses: Influence of particle size and size distribution. Powder Technology. 2020;364:98-114. DOI