

Why a powder quality fingerprint beats a folder of tests
Many teams test only when a batch fails. They collect data, then move on. That habit hides slow drift and turns root cause work into guesswork. A powder quality fingerprint solves that. It is a small, repeatable panel you run on every incoming lot. Light enough for routine use, yet sensitive enough to flag change before the line feels it.
Below is a six-parameter panel you can implement within a week. Each marker links to a practical decision rule so QA can act, not just report.
The minimal panel: six markers that matter
Particle size distribution (D10, D50, D90, span)
Measure by dry laser diffraction. Use a short sieve stack when lasers are not available. Record D10, D50, D90, and compute span as (D90−D10)÷D50(D90 − D10) ÷ D50. Track all four values. Lock the optical model, dispersion settings, refractive index, and obscuration. Keep them constant.
Action rule: if span shifts more than 10 percent from baseline, move to Amber. When D90 grows while fines drop, expect slower dosing and higher torque. Plan a feeder speed change or gentler hopper vibration. Validate settings on your line.
Moisture state (loss on drying, water activity, or Karl Fischer)
Choose one method and lock it. Loss on drying captures total volatiles under set time and temperature. Karl Fischer measures water specifically. Water activity shows how available that moisture is for caking and reactions. Precondition samples to the same room humidity for consistency.
Action rule: if moisture rises above the baseline mean by more than two standard deviations, move to Amber. Add dehumidified air near the hopper or shorten storage time. If water activity exceeds the agreed limit, move to Red and hold. If you raise humidity to reduce static, confirm that caking risk does not increase.
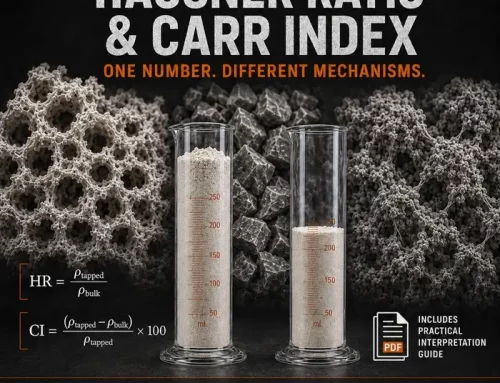
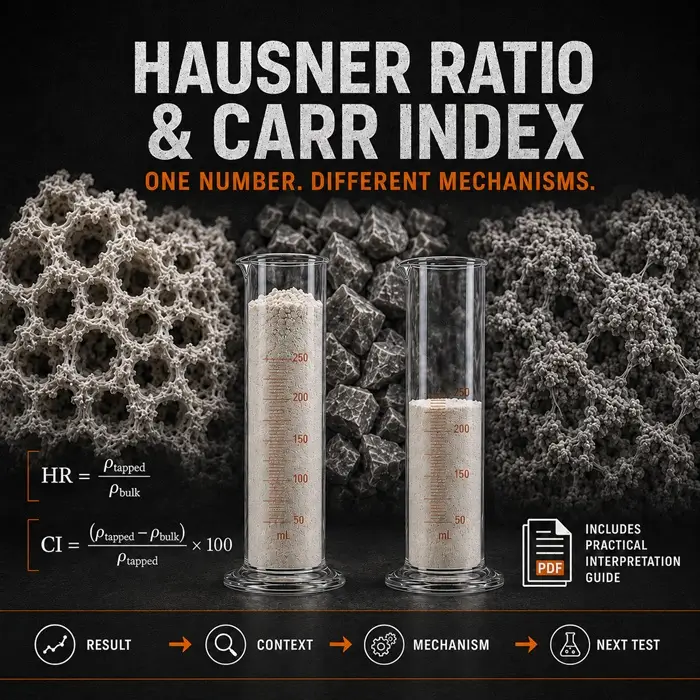
Bulk density, tapped density, and Hausner ratio
Measure bulk density, then tap to a steady value. Compute Hausner ratio as tapped divided by bulk. It reflects packability and a tendency to arch.
Action rule: treat HR > 1.25 as at risk for poor flow into screws and higher segregation. Move to Amber, reduce drop heights, and limit vibration. If HR > 1.35, move to Red and investigate upstream compaction or moisture. After 20 to 30 lots, set product specific limits based on line behavior.
Reference limits and methods are defined in USP<616> Bulk and Tapped Density.
Flow function or a fixed geometry orifice time
If a ring shear cell is available, report the flowability index at two consolidation levels: ffc = σ₁ ÷ σc. Use for example 3 and 9 kPa. Treat ffc < 4 as potentially problematic for smooth hoppers without aids.
No shear cell? Run a timed discharge through a funnel with fixed wall angle and material, three orifice diameters, and constant fill height.
Action rule: if time to empty rises by more than 15 percent at two orifices, move to Amber. Add low intensity hopper vibration and check aeration set points. If the largest orifice shows a step change, move to Red. Note that this test reflects cohesion and arching tendency, not full silo behavior.
Electrostatic tendency (Faraday cup preferred, bottle test as trend)
A Faraday cup gives quantitative charge to mass in µC per kg. Use it when setting limits. As a low cost proxy, agitate a set mass in a standard polymer bottle for a fixed time, then measure surface field near the wall with a hand meter. Keep geometry, mass, time, and probe distance identical.
Action rule: if charge per mass exceeds your control limit, move to Amber. Improve grounding, bonding, and equalization across metal parts, liners, and flexible connectors. Slow transfer velocity and adjust humidity in a controlled range. If parts cling to walls during the proxy test, treat as Red for enclosed conveying.
Morphology check under low magnification
Spend five minutes on a consistent imaging routine. Look for fresh angular fracture, fused agglomerates, or plate-like particles. Capture images at the same magnification and illumination. Keep a reference board. If available, run simple image analysis to count features above a set area threshold.
Action rule: if the agglomerate count doubles relative to baseline, move to Amber. Add a short de-lumping step or screen at 500 micrometers. When sharp fragments appear after a new milling step, alert procurement and quarantine.
Sampling that does not lie
Sampling errors ruin good panels. Collect increments while the material flows. Take small increments across the entire discharge. Combine them into one composite, then split with a riffle or a rotary divider. If the powder is static, take increments from multiple depths and locations. Never scoop from the top and call it representative.
Set baselines fast, then refine
Start with five to ten known good lots. Run the full panel and build provisional means and standard deviations. These are your first control lines. After twenty lots, update the baselines and tighten the guard bands. Use control charts for D10, D50, D90, moisture, and HR. Derive control limits from in-control data, not from specifications. Keep separate safety bands for Red decisions.
You will see which markers move together. Higher moisture often lifts HR and slows orifice discharge. Use those links to predict behavior on the line and to target fixes.
Make it actionable: the three bucket rule
Turn QA into decisions with three clear buckets. Post the rules at goods in and in the control room.
-
Green: all six markers within control limits. Receive and release. No process change.
-
Amber: one or two markers outside limits, yet within safety bands. Run with a defined adjustment. Use dehumidified air, lower transfer velocity, add gentle vibration, or widen feeder gap. Record the change in the lot traveler. Validate the threshold against line KPIs such as feeder speed, torque, and rejects after the first 20 to 30 lots.
-
Red: any critical marker beyond the safety band, or three markers outside limits. Hold the lot, notify procurement, and run a confirmatory test. Document the nonconformance and open a supplier query.
Keep it cheap, consistent, and fast
You can run this panel with basic tools. A sieve stack, a tap density cylinder, a scale, a timer, a standard bottle, and a simple microscope go a long way. Add laser diffraction, a shear cell, a Faraday cup, or helium pycnometry as the plant matures. The aim is not perfect science. The aim is to produce repeatable signals that predict line behavior.
Common pitfalls and how to avoid them
-
Teams change methods midstream. Lock procedures and train operators.
-
Preconditioning is inconsistent. Control sample humidity, time, and temperature.
-
Lots are compared across different orifice diameters. Fix geometry and fill height.
-
Vibration is added everywhere. Check for increased segregation downstream.
-
Data stays in spreadsheets without charts. Use control charts and share them.
What good looks like after one month of applying the powder quality fingerprint
Expect fewer feeder slowdowns and fewer cleanouts. You will catch wet or compacted lots before they hit the hopper. The line will need smaller changes, because you know which markers moved and why. Most importantly, your team will stop being led by opinion and start acting on data and signals.


