

Electrostatic problems often look random. Lines run fine, then fail without warning. Average charge measurements can look safe. Yet local charge can spike to dangerous levels. Recent work shows charge peaks that standard tools miss. The risk hides in the spatial distribution, not the net value.
A new measurement approach resolves charge across the flow cross-section. It compares particle motion with and without an electric field and reconstructs local charge profiles. The average aligns with a Faraday pail. However, the resolved peak can be seventy-six times higher than the average. Another study found an eighty-five times peak near a duct wall. Those peaks can act as ignition sites even when the bulk reads safe.
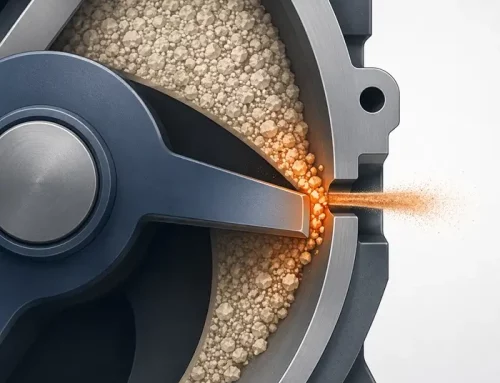
Why do these peaks form. Bipolar charging develops as unlike particle sizes collide and exchange electrons. Turbulence and wall effects separate charges and create pockets of high potential. The bulk looks neutral. The local field does not. Relying only on net readings creates false comfort in hazardous steps.
What this means for plant engineers
-
Re-frame the hazard model. Treat electrostatics as a spatial problem. Do not trust only the net value. A zero or low average can mask a critical local peak. Add spatial diagnostics to high-risk nodes.
-
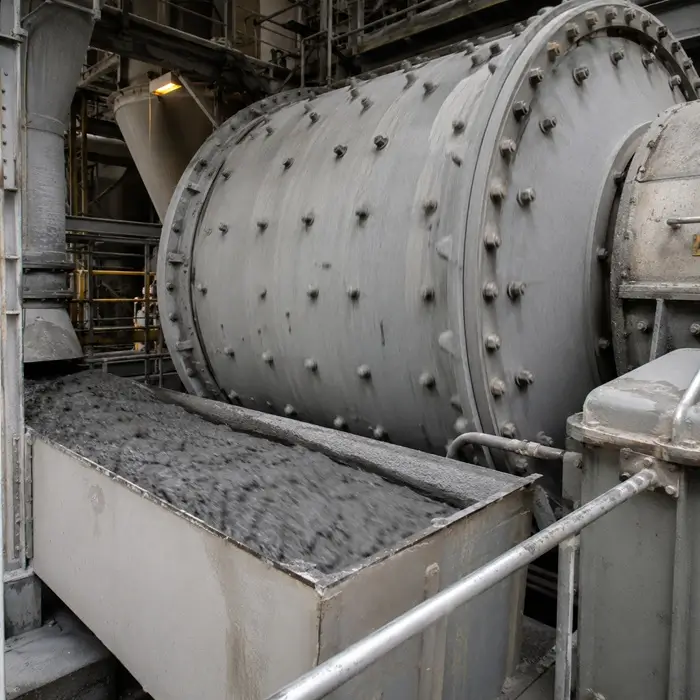
Instrument priority points. Focus on bends, reducers, splitter tees, and near-insulating liners. Pay attention to wall layers in dilute or transitional flow. Probe where velocity gradients and slip exist. These zones favor charge segregation.
-
Use multi-channel evidence. Combine spatial charge sensing, oxygen level, and acoustic signatures. A rising high-frequency band can signal plate build-up or agglomeration. Correlate these signals with charging events and fouling on inspections.
-
Tune mitigation locally. Grounding and humidity control remain essential. Yet you may need targeted actions. Consider conductive wall sections, localized ionization, or coatings at known hotspot zones. Validate with before-and-after spatial profiles.
-
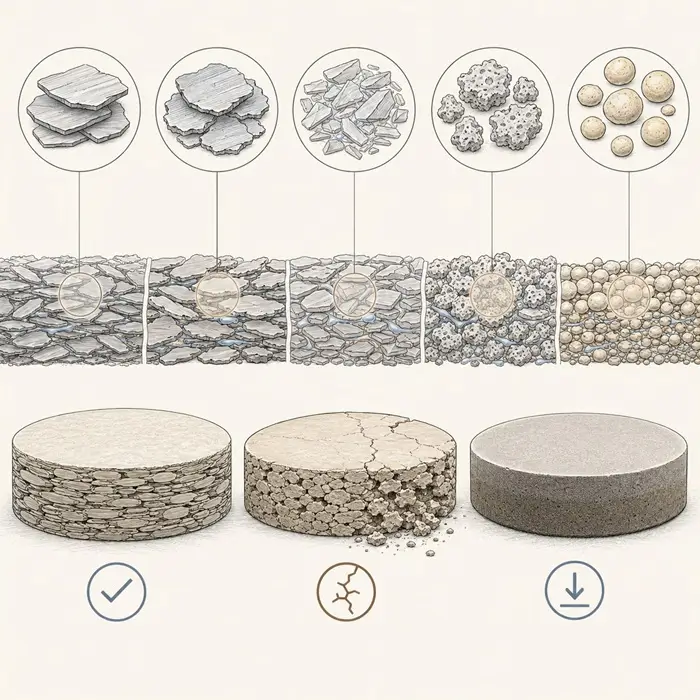
Exploit turbulence thoughtfully. Wall-bounded turbulence can narrow the charge distribution in some regimes. This effect depends on Stokes number and polydispersity. Use CFD and trials to see whether your operating window helps or harms. Then set set-points accordingly.
A practical test plan: For hidden charge peaks in powder flows
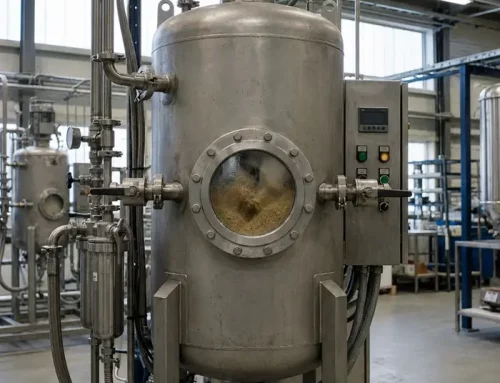
Start with a critical conveyor or pneumatic line. Map flow conditions. Record gas velocity, solids loading, humidity, and temperature. Run a baseline with your Faraday method. Then add a spatially resolved step at two or three cross-sections. If full spatial hardware is unavailable, use a proxy. Move a localized sensing head radially and reconstruct a coarse profile. Repeat at two flow rates and two humidity levels. Compare peak-to-average ratios. If the ratio exceeds ten, treat the location as a hotspot.
Close the loop with remediation. Add a conductive insert near the peak. Test a different liner. Adjust humidity within material limits. Evaluate ionization only where peaks persist. Rerun the spatial map. Lock in measures that reduce the peak without harming flowability or product quality.


