

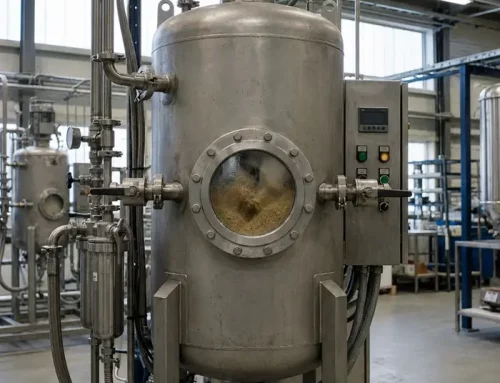
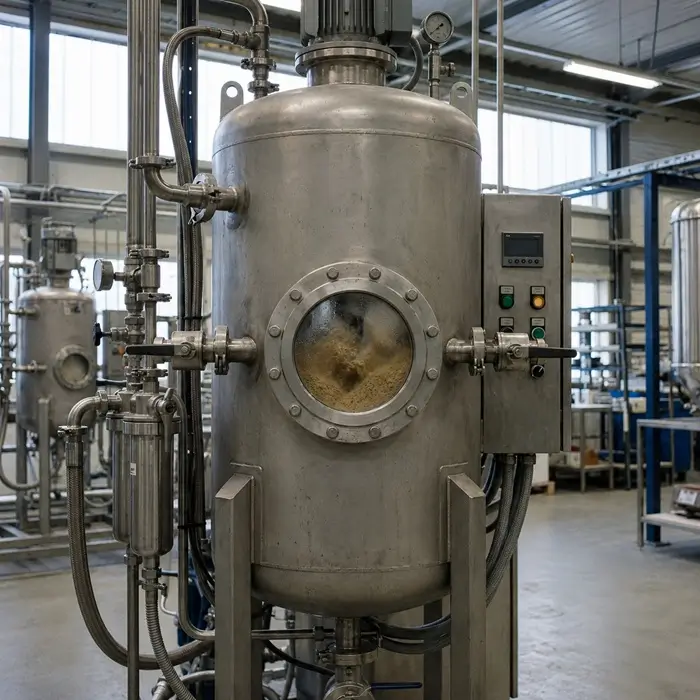
A quick case from the plant floor
A team shipped a powder that met the moisture spec. The blend flowed well on Friday. On Monday, the hopper arched and the feeder pulsed. Moisture still read “in spec” in the lab. The missing clue was water activity. The bags sat near a warm packing area, and the powder picked up a small amount of mobile water (It is the fraction of water that migrates to particle surfaces and forms thin films or liquid bridges. That water increases cohesion fast, so you see caking, sticking, or poor discharge). That change raised aw and strengthened particle contacts. After that, the same batch behaved like a different grade.
Once they tracked aw, the pattern became clear; the solution was to tighten storage control and improve the bag barrier. And so, the Monday problem disappeared.
Moisture is a number, but behaviour is a mechanism
Many plants track moisture as a single percentage. That value feels objective and safe. However, powders do not respond to mass water alone.
Two powders can have the same moisture content and yet act differently. One flows clean and doses steadily. The other clumps, smears, or form a crust. This mismatch frustrates teams because the lab result looks fine. Water distribution drives the difference. Contact physics does the rest.
What water activity really captures
Water activity, denoted as aw, describes how much water is available at particle surfaces. In simple terms, it reflects the water vapor pressure in equilibrium with the powder. That is why aw predicts whether water will form thin surface films, create liquid bridges, or soften binders.
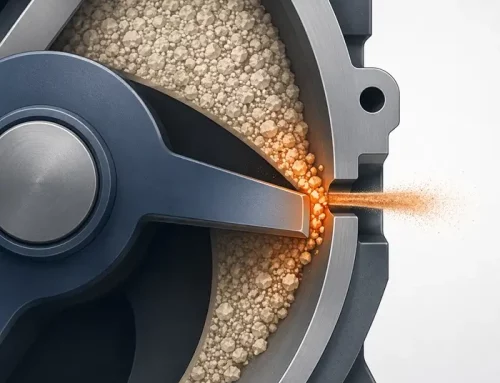
Some powders hold water inside pores or crystalline structures. That water adds to the moisture content, but it does not easily reach contact points. Other powders hold a smaller amount on the surface. Surface water can move and form bridges quickly, which increases cohesion and triggers caking or sticking.
Moisture content tells you how much water is present. Water activity tells you how likely that water will change flow, amongst other things.
It also influences sticking, agglomeration, compaction behavior, and chemical stability during storage.
The earliest symptoms aw tends to predict
When aw rises, you often see changes before moisture moves:
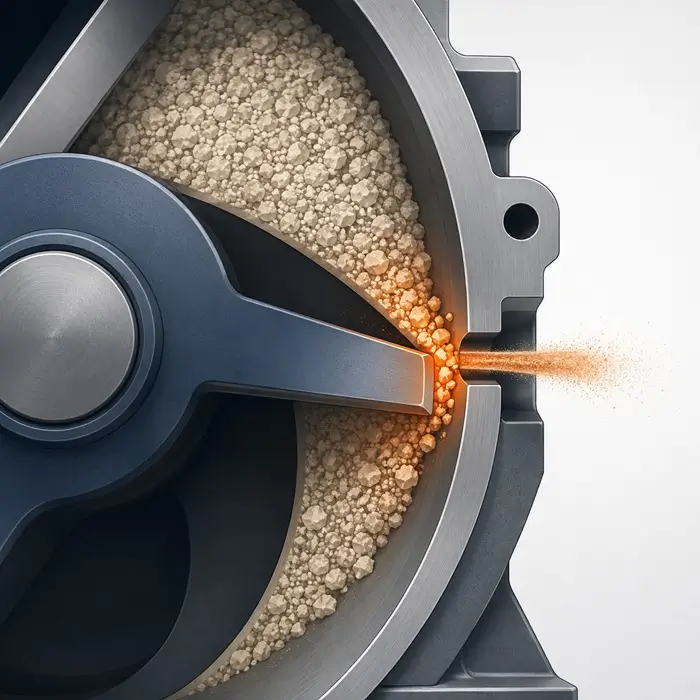
- Feeder torque increases, and torque swings widen.
- Discharge becomes less stable, with pulses or sudden stalls.
- Buildup grows on walls, chutes, or valve seats.
- Sieve blinding appears sooner in screening steps.
If you log one signal, start with the feeder torque trend, because torque responds fast to rising cohesion and wall friction; it often shifts before you see visible caking or a moisture change.
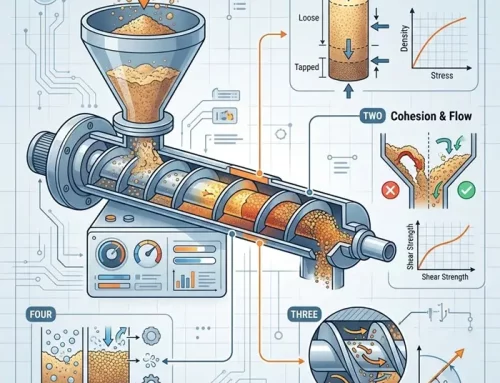
Why equal moisture can still give different flow
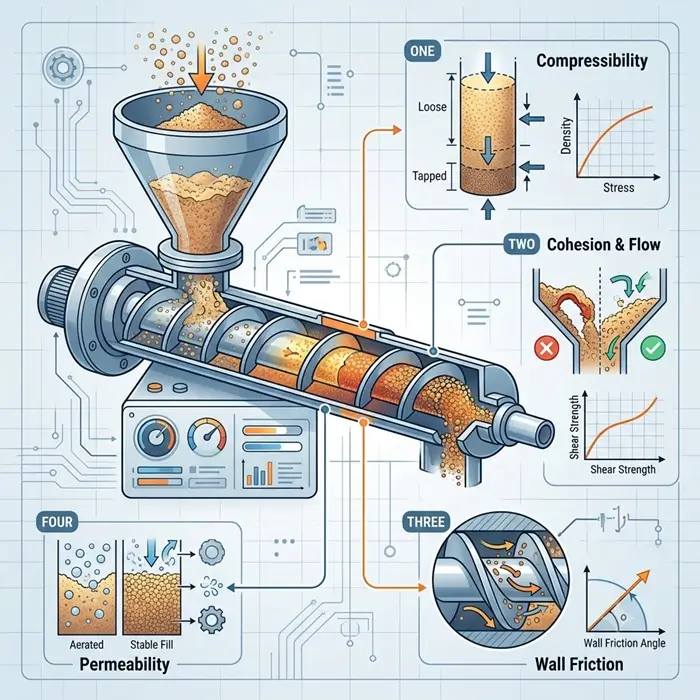
Several drivers push powders in opposite directions.
Surface chemistry
Oxides, salts, and polar polymers attract water. Thin films change friction and adhesion at contacts. Consequently, cohesion can rise before moisture registers as significant.
Porosity and internal adsorption
Porous particles can absorb water inside their pores, which increases the moisture result. However, it may not reach the outer surface where particles touch. As a result, the powder can still flow well. Flow usually shifts when aw rises, because that indicates more water is available at the surface.
Amorphous phases and soft binders
Amorphous solids can take up water and soften. Some binders also plasticize. That raises the contact area at particle contacts and increases stickiness. As a result, even a small humidity increase can trigger sudden sticking.
Fines
Fines increase surface area and create more contact points between particles. That makes the powder more sensitive to small increases in stickiness. As a result, problems can start at a lower aw when the fines fraction is higher.
The possible QA Blind Spot: Moisture Without aw
Many QA programs rely on a single moisture check at intake. That works until storage conditions or packaging shift water toward particle surfaces.
The pattern is predictable:
-
Moisture passes at receiving.
-
The run starts clean.
-
Storage adds humidity cycling or temperature swings.
-
Discharge turns unstable.
-
Moisture still reads “in spec.”
Then the discussion turns to operator error, while the real driver is aw.
How to use aw without adding complexity
You can start small and still get value.
1) Add aw only for repeat issues
Use it for powders with seasonal drift, caking complaints, or dosing instability.
2) Record the sample’s short history
Log storage time, bag type, liner, and temperature exposure. Those details shift water distribution fast.
3) Pair aw with one process signal
Pick one signal first, like feeder torque or discharge stability. Keep the first correlation simple.
4) Set an action limit that triggers a response
Moisture limits often stay too wide to protect flow. In contrast, an aw action limit can trigger drying, conditioning, or faster use.
What to do when aw runs high
Fixes depend on the mechanism, so avoid blanket solutions.
- If liquid bridging drives cohesion, reduce aw and improve barriers.
- If a binder softens, tighten the aw window or change the binder grade.
- If fines amplify the shift, reduce attrition, and tighten PSD control.
- If humidity cycling drives drift, stabilise the dew point and storage temperature.
Once you track aw, troubleshooting gets calmer. You stop arguing with a moisture percentage.

")
