
Table of contents

Every plant has places where the air never feels completely clean. Operators talk about “a bit of dust” around the bag dump station or above a transfer chute. Drawings do not show that haze. Piping diagrams show silos, feeders, and hoppers. Dustiness lives between those lines, where powders meet air and people.
Powder dustiness often stays invisible in formal discussions. It rarely appears as a line in a material specification. It is rarely a deliberate design criterion during early project stages. Yet it shapes daily exposure levels, filter life, cleaning effort, and explosion scenarios.
This Know How article treats powder dustiness as something you can understand, measure, and control. It focuses on practical situations in industrial plants, where a large part of the work still involves bags, drums, and open steps, even when high-grade automation is present elsewhere.
What powder dustiness really is
Powder dustiness describes how easily a material generates airborne particles when it is handled. It is not just “fines content”. Two products can share the same particle size specification and still behave very differently, because other properties matter as well.
Several factors shape powder dustiness.
- Particle size distribution influences how long particles stay airborne.
- Particle shape and density affect how they bounce, roll, and separate during movement.
- Mechanical strength decides whether agglomerates break and create fresh fines.
- Surface chemistry and moisture define how strongly particles adhere or repel each other.
Handling conditions then amplify or dampen these tendencies. Long drop heights, turbulent air, and high impact speeds create more airborne dust. Gentle transfer, short falls, and calm air reduce it.
You can think of powder dustiness as the interaction between material behaviour and process conditions. The same powder may behave acceptably in one installation and cause constant haze in another, purely due to geometry and airflow.
Where powder dustiness appears in daily operations
Anyone who spends time on the shop floor can point to the dustiest tasks. Those tasks often sit outside the main process route, in transfer zones and manual handling points.
Typical examples include:
- Cutting and emptying bags into hoppers or dissolvers
- Discharging FIBCs through spouts or liners
- Hand scooping and weighing powders at open benches
- Cleaning spills and build-up around filling heads
- Emptying dust collectors and filter hoppers
- Opening manways or inspection ports on powder equipment
Each of these activities forces powder and air to change state. When a bag is opened, air flows in. When a hopper fills, air must escape. When a filter empties, trapped dust moves suddenly. Every state change creates an opportunity for fine particles to detach and travel.
Settled dust is not harmless either. Vibrations, forklift traffic, and local air movements can resuspend old deposits. Those deposits often consist of the finest, driest fraction, which is most likely to penetrate deep into the lungs and to form flammable clouds.
A realistic view of powder dustiness, therefore, starts with a task map. You list where powder and air meet, who is present, and what the visual dust level looks like. That map becomes the backbone of any improvement plan.
Why powder dustiness matters so much
Dust on the floor or on beams is easy to see. The real impact of powder dustiness runs deeper. It affects health, safety, product quality, and operating costs at the same time.
Health and long term exposure
Airborne particles enter the respiratory system and deposit at different depths, depending on size. Larger inhalable particles mainly affect the nose and throat. Smaller respirable particles can reach the alveoli and stay there for long periods.
Some powders present mainly a mechanical burden. Others carry specific chemical or biological risks. Both types deserve attention. The crucial point is that workers rarely breathe an average concentration. They experience short peaks during dusty tasks, combined with a background level for the rest of the shift.
High powder dustiness at a few manual operations can dominate long-term exposure for a small group of operators. Even when average room measurements look acceptable, these peaks can drive complaints and health issues.
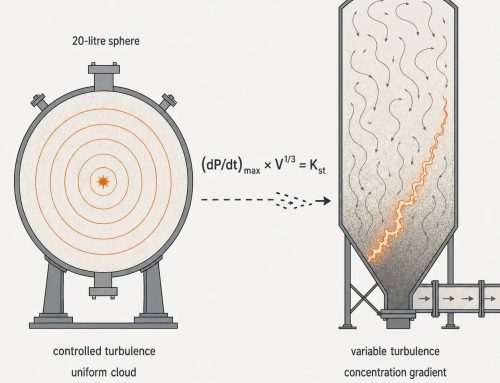
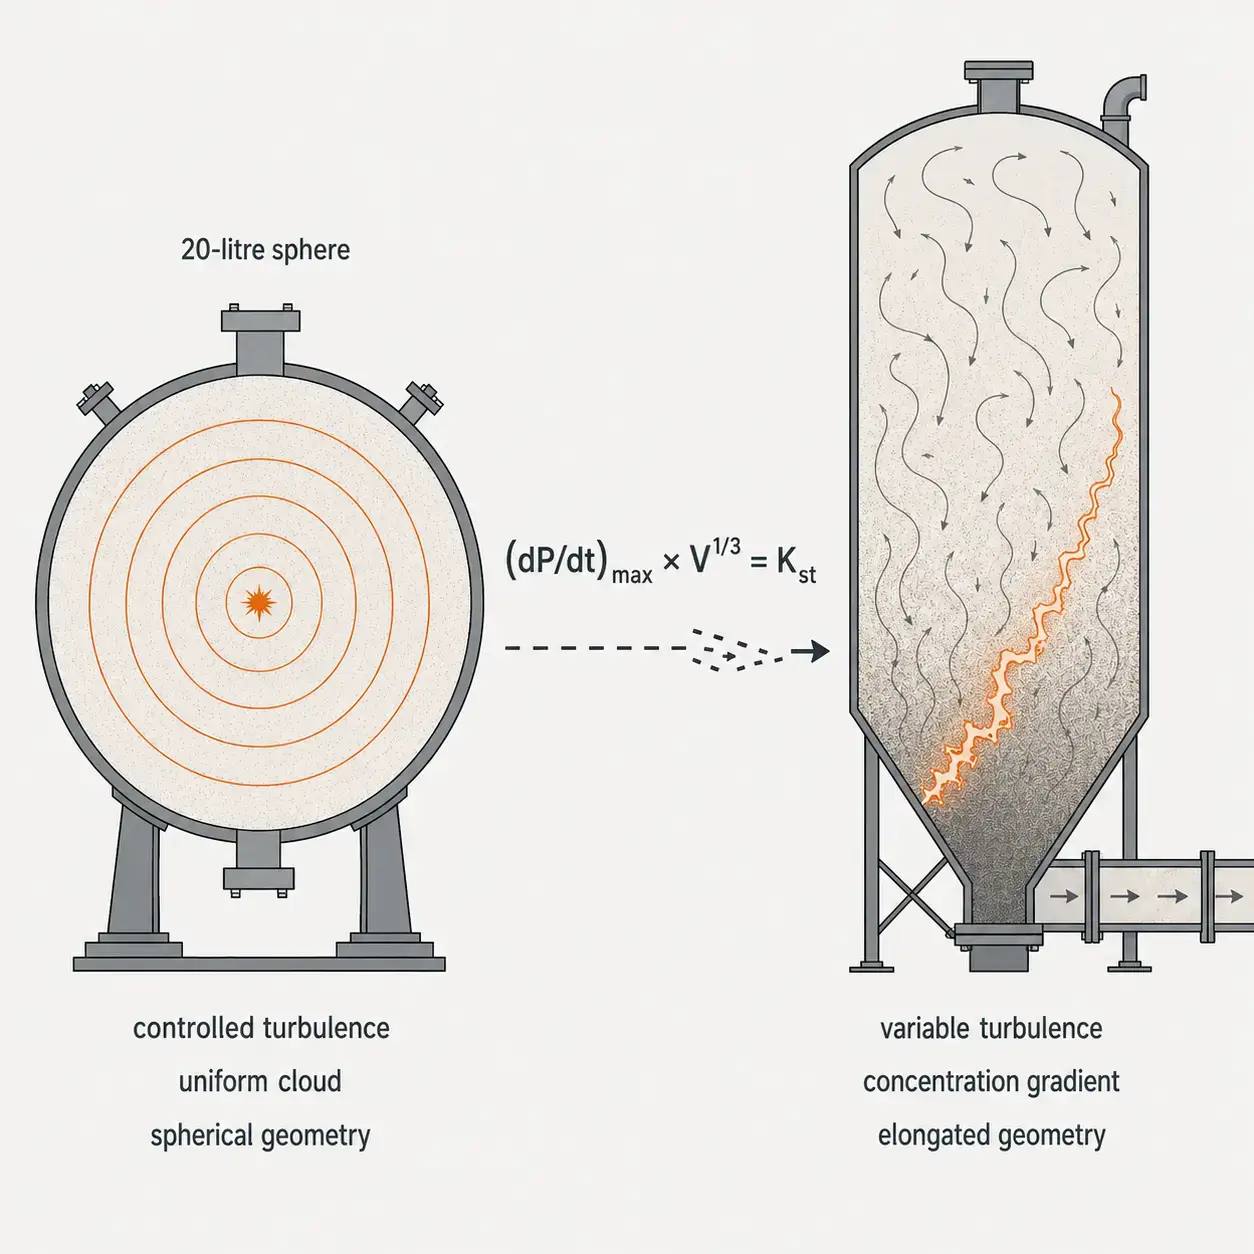
Explosion and ignition risk
Combustible powders can explode when dispersed in air at sufficient concentration in the presence of an ignition source. Powder dustiness strongly influences how easily explosive clouds form, both inside equipment and in rooms.
Fine particles that escape and settle on cable trays, beams, and ducting increase the available fuel load. A single disturbance can resuspend that dust and create a cloud. Inside filters, cyclones, and enclosed spaces, dustiness affects how often clouds form during normal operation.
Reducing powder dustiness and containing it near sources narrows the range of realistic explosion scenarios. It reduces the probability of both primary and secondary events.
Check out this interview: Dust Explosion Risks and Safety Protocols with Michel Vandeweyer
Cross contamination and product quality
Escaped dust lands on equipment, clothing, and structural elements. Later, small fractions can migrate into other products. In high-value or regulated sectors, even a tiny carryover may break specifications. Examples include active pharmaceutical ingredients, potent flavours, allergens, and high-performance pigments. Lower powder dustiness, combined with better containment, reduces cross-contamination risk and simplifies cleaning validation. It also stabilises product quality, since less material leaves the intended path.
Operating costs and housekeeping
Finally, powder dustiness affects costs that rarely appear as single line items. Filters clog faster. Fans draw more power. Cleaning teams spend more hours on the same zones, often during valuable downtime windows. A structured dustiness programme does not just reduce risk. It often pays back through lower filter consumption, fewer incident investigations, shorter cleaning campaigns, and smoother audits.
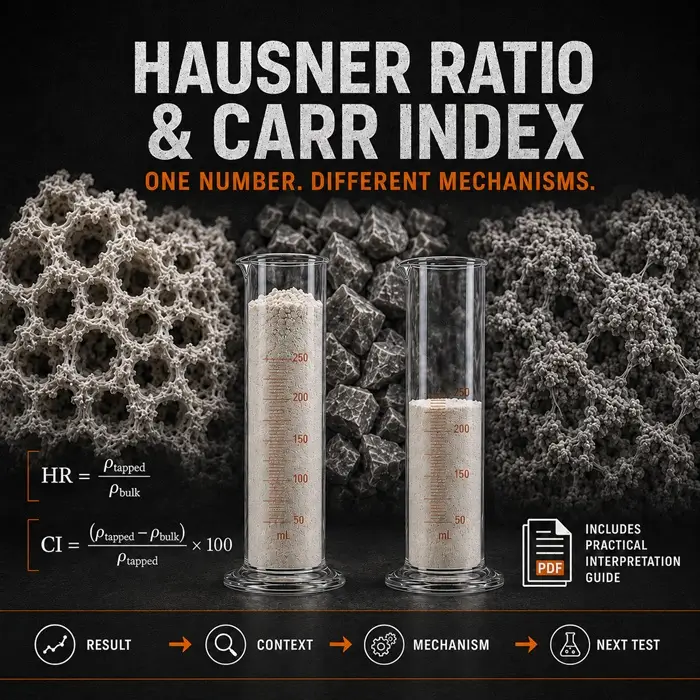
Measuring powder dustiness in practice
Once you treat powder dustiness as a property, measurement becomes possible. The goal is not to chase a perfect single number. The goal is to build a consistent picture that supports decisions.
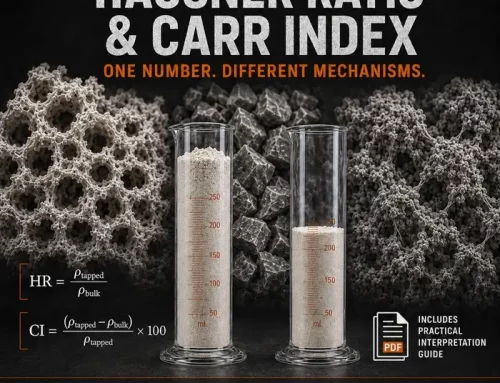
Laboratory dustiness tests
Standard dustiness tests expose a defined powder sample to controlled agitation. Rotating drums, falling streams, or shaking enclosures create airborne particles. These particles pass through size-selective inlets and are collected on filters.
The test then reports dustiness indices, often expressed as milligrams of airborne dust per kilogram of material. Some methods separate inhalable and respirable fractions.
Laboratory dustiness tests help you:
- Compare different grades of the same material
- Evaluate the effect of granulation or surface treatment
- Classify powders into dustiness bands for design purposes
They do not replicate every plant condition. However, they provide a consistent baseline and a ranking across materials.
Simple plant indicators
Many insights come from straightforward observations that cost very little.
Useful indicators include:
- Filter pressure trends and change out frequency
- Amount of material collected during routine cleaning
- Time needed to clean specific rooms or lines after production
- The speed at which standard surfaces become visibly dusty
- Operator comments about air quality during specific tasks
These indicators may feel subjective at first. When you document them with dates, products, and tasks, they turn into useful data. If one area consistently demands three times more cleaning than others, powder dustiness is part of the reason.
Exposure and concentration measurements
Occupational hygiene teams can measure airborne concentrations using personal pumps and static samplers. Results show inhalable and respirable dust levels over defined periods.
Measurements like these validate whether engineering changes work. They help you compare different operating modes, start-up procedures, or cleaning strategies. They also support communication with regulators and internal safety committees.
Combined with laboratory data and plant indicators, these measurements create a three-dimensional view. Each method highlights a different aspect of powder dustiness and its impact.
Design and process choices that drive powder dustiness
Powder dustiness is not fixed at the material level. Design and operating choices amplify or dampen it. Some patterns appear across many plants and industries.
Drop heights and impact zones
Every time powder falls, particles accelerate and hit surfaces or other particles. High drop heights at significant flow rates create intense impact. That impact breaks weak agglomerates and throws fine particles into the air.
Even modest reductions in drop height can reduce dust generation. Curved chutes, cascading steps, or impact plates can soften falls and keep most movement inside enclosed paths.
Designers sometimes neglect to consider vertical distance. In reality, every extra metre of fall adds energy and therefore dust.
Air paths and pressure balance
Powders never move alone. They push and pull air with them. When a silo fills from the top, air must leave through some route. When a bag dump hopper receives material, displaced air tries to escape.
If the design does not define that path, air will find its own. It may push through gaskets, flexible connectors, instrument ports, and inspection hatches. Each small leak becomes a concentrated dust jet.
Correct venting and extraction give air a low-resistance path through filters. Proper pressure balance stops dust-laden air from migrating into adjacent rooms or corridors.
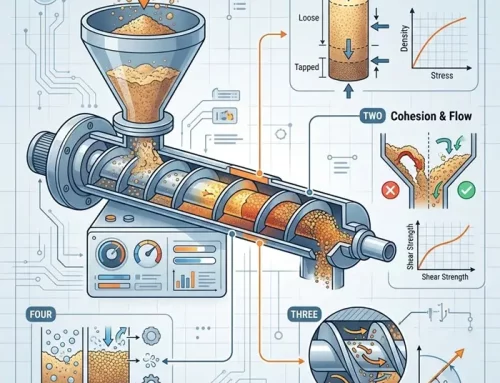
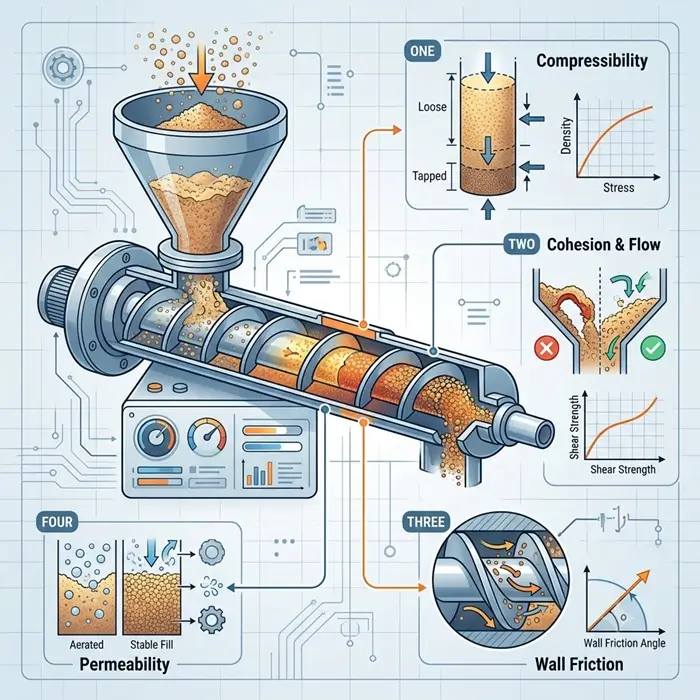
Handling mode and conveying choice
Plants move powders with gravity chutes, screw conveyors, bucket elevators, belt systems, and pneumatic lines. Each mode stresses the material in a specific way.
Lean phase pneumatic conveying generates high velocities and repeated collisions. That can raise fines content and powder dustiness over time. Dense phase systems reduce velocity but still require careful leak control at pipeline connections and discharge points.
Mechanical systems generate less airborne dust inside the conveyor. However, inlets and outlets still need proper containment and venting. Bulk density, cohesion, fragility, and abrasiveness all influence which options are realistic.
Considering powder dustiness during equipment selection prevents surprises later. It also avoids costly retrofits to correct avoidable leaks and emissions.
A practical hierarchy of dust control
Once you understand where powder dustiness appears and which products drive it, you can structure control measures. A simple hierarchy helps to balance ambition with practicality.
Reduce powder dustiness at the source
Sometimes the most effective step is to change the material or its presentation.
Granulated grades often show lower dustiness than finely milled powders. Slightly coarser cuts may still meet product requirements while releasing fewer respirable particles. Surface treatment can also reduce dust formation for some products.
Packaging and logistics also matter. Bulk deliveries or FIBCs reduce the number of openings and dumps. Fewer manual bag operations mean fewer high-dust peaks. These changes require commercial alignment. They also remove a significant fraction of dust at the earliest possible stage.
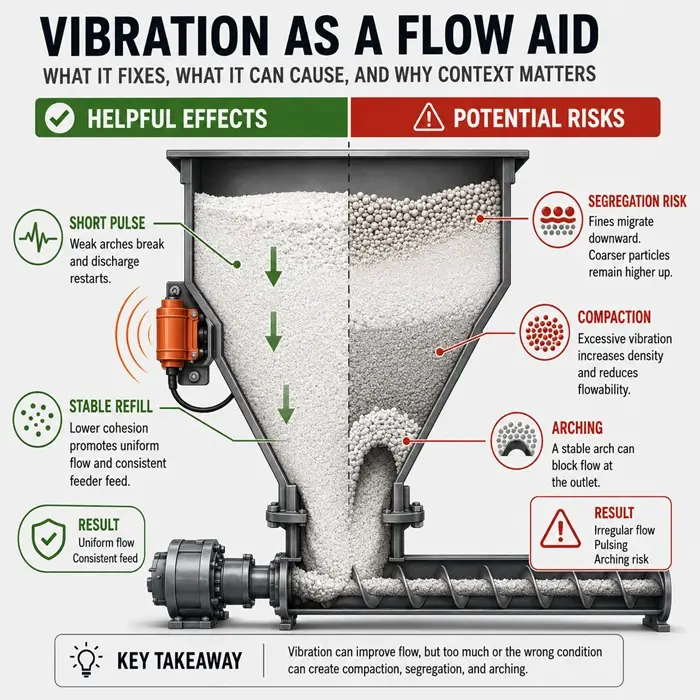
Optimise the way powders are handled
When material substitution is not realistic, focus on how the process moves the powder.
Examples include:
- Converting open bag tipping into enclosed discharge units
- Reducing free fall distances at transfer points
- Adjusting filling profiles to avoid violent first seconds
- Installing calm zones where air can separate from powder before venting
These modifications treat powder dustiness as a core design parameter. They often improve yield, cleanliness, and ergonomics at the same time.
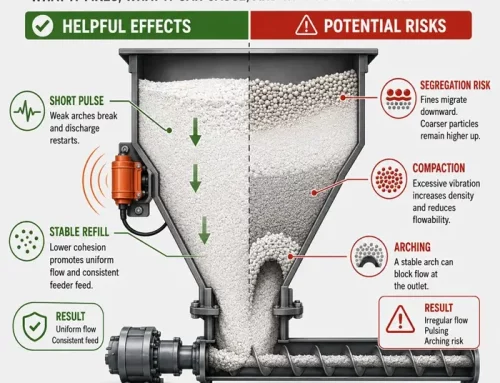
Enclose sources and capture dust locally
For manual handling tasks that remain, enclosure and local exhaust ventilation are usually central.
Effective solutions:
- Place the operator outside the main dust zone
- Maintain a slight negative pressure inside enclosures
- Provide an extraction close to the emission point
- Use filters and fans sized for realistic airflow and dust loads
Examples include downflow booths, glove boxes, contained bag dump stations, and local hoods on transfer points. Smoke tests and airflow measurements help verify that air moves in the correct direction and at the appropriate velocity.
Support with procedures and personal protection
Engineering controls shape the environment. Procedures and personal protection address the remaining risk.
Practical measures include:
- Clear instructions for opening and emptying bags and FIBCs
- Defined rules for cleaning methods and compressed air usage
- Training on the correct use and limitations of respirators
- Planning to avoid multiple dusty tasks in the same room at once
Personal protective equipment remains the last line of defence. It is vital to identify where residual risk cannot be engineered out or where short tasks do not justify large investments. It should not carry the full burden of control.
Building a dustiness roadmap for an existing plant
Most plants operate with legacy equipment, mixed product portfolios, and tight budgets. A dustiness roadmap turns a wide challenge into a sequence of manageable steps.
Step 1: Map dusty tasks and areas
Start by listing the tasks that create visible dust or repeated complaints. For each task, note:
- Location and short description
- Products involved
- Frequency and typical duration
- Number of people nearby
- Rough visual dust level on a simple 1 to 5 scale
- Existing controls such as enclosures, extraction, or PPE
This mapping exercise already reveals patterns. Some rooms carry many high-dust tasks. Others stay clean.
Step 2: Combine mapping with material information
Next, overlay material properties and any available dustiness data.
- Mark, which powders are known to be very dusty
- Flag combustible materials with relevant explosion data
- Note materials with strict exposure or cross-contamination limits
Tasks that combine dusty products, frequent performance, and many people deserve high priority. Tasks with low dust levels, rare occurrences, and stable controls can stay in the background.
Step 3: Identify quick wins
Before designing major projects, look for changes that require little investment.
Examples include:
- Replacing damaged seals and flexible connectors
- Lowering simple drop heights at transfer points
- Adjusting bag opening techniques and platforms
- Improving housekeeping tools, such as certified industrial vacuums
These quick steps reduce background dust and build momentum. They also demonstrate that the roadmap has a concrete impact.
Step 4: Define targeted engineering projects
For high-priority tasks, design specific engineering measures. Examples are:
- New enclosed bag dump stations with integrated extraction
- Upgraded vent filters on silos and bins
- Downflow booths for weighing and sampling
- Closed transfer systems for high-potency or allergenic powders
Each project should include clear objectives, such as expected reduction in visual dust, exposure levels, or cleaning hours. That clarity supports investment decisions.
Step 5: Verify improvement and adjust
After implementing changes, return to the original task map.
- Repeat visual assessments and cleaning time measurements
- Review filter trends and exposure data where available
- Discuss the perception of air quality with operators
If results match expectations, embed the new standard into procedures and training. If not, revisit design details and airflow patterns. Dustiness control remains part of continuous improvement, not a one-time campaign.
What the Know How PDF provides
The Know How PDF turns this long read into a practical tool for plant use. It adds three elements that support direct action.
First, it includes a one-page powder dustiness overview. This page explains the concept in simple terms, introduces a four-level dustiness scale, and provides space to list site-specific powders in each band. It gives everyone a shared language before deeper discussions.
Second, it offers a dustiness task mapping sheet. This structured table guides walk-throughs and workshops. Columns capture task description, location, products, frequency, duration, people present, visual dust level, existing controls, and short comments. The sheet transforms informal knowledge into a documented picture of dusty operations.
Third, it contains a priority and action planner. This section helps teams select high-impact tasks, choose target control levels, describe planned measures, and assign responsibilities and target dates. It supports regular reviews and keeps dustiness improvements on the agenda.
Together, these pages help move powder dustiness from a vague concern to a visible, trackable part of plant performance. They connect the concepts in this article to daily decisions on the shop floor.
Conclusion: treating powder dustiness as a design parameter
Powder dustiness will always exist wherever solids move and air flows. The real question is whether that dust appears in controlled places or drifts through the plant on its own terms.
When teams treat powder dustiness as a measurable property and a genuine design parameter, decisions change. Material selection, packaging choices, equipment geometry, and extraction design all receive a new lens. Mapping tasks, using available dustiness data, and applying a simple hierarchy of controls make that lens practical.
The result is cleaner air, lower exposure, reduced explosion risk, fewer cross-contamination surprises, and more predictable cleaning. In the end, managing powder dustiness is not only a safety exercise. It is a way to bring order and reliability to the fine particles that never show on the P&ID.


