
Article Update – 25 September 2026

Why In-Line Particle Size Is Harder Than It Looks
Particle size influences milling, granulation, coating, blending, dissolution, flow and many other powder-processing outcomes. Measuring it while material is moving through the process can shorten the delay between a change in operating conditions and the information available to the process team.
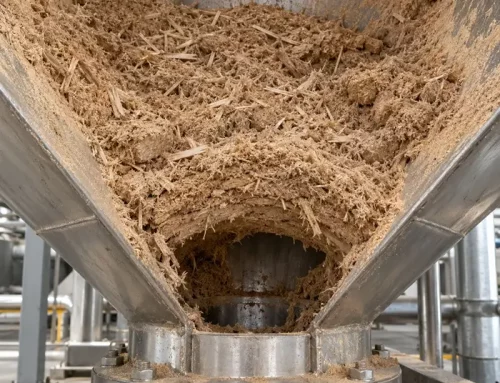
Direct imaging appears attractive because individual particles can be observed rather than inferred from an ensemble signal. The difficulty is obtaining images that can actually be measured. In a dense process stream, particles overlap, pass through different focal planes, move at different velocities and may be only partly visible. Illumination, window condition and solids concentration can further change what the camera sees.
Conventional image analysis generally performs best when particle boundaries can be distinguished cleanly from the background and from neighboring particles. AI becomes technically relevant because it can recognize which image regions contain particles that can be measured and, in more advanced implementations, determine individual particle outlines despite overlap and variable focus.
Where AI Imaging Sits Among In-Process Particle-Sizing Methods
AI-assisted imaging is not the only way to obtain particle-size information during processing. Online laser diffraction, spatial filter velocimetry, focused beam reflectance measurement, photometric stereo imaging, and other direct-imaging systems have all been used or investigated for real-time or near-real-time process measurement.
A pharmaceutical comparison published by Silva and co-workers examined spatial filter velocimetry, focused beam reflectance measurement, photometric stereo imaging, and the Eyecon direct-imaging technology alongside off-line laser diffraction and sieve analysis.[2] The study highlighted a fundamental issue: different instruments do not necessarily measure the same particle property. Depending on the technique, the underlying result may be derived from particle dimensions, chord lengths, projected images, or another optical interaction. Results may then be reported on number, area, volume, or mass-related bases.
The choice of an in-process method should therefore start with the process question rather than with a search for whichever technique most closely reproduces a familiar laser-diffraction number.
Direct imaging has an important advantage when more than a single bulk size distribution is useful. A sufficiently resolved particle image can also contain information about aspect ratio, circularity, surface appearance, and potentially particle identity. AI expands the range of process images from which that information can be extracted.
The trade-off is equally important. Imaging observes a finite local field of view and requires particles to be sufficiently resolved optically. Depth of field, magnification, pixel resolution, illumination, particle velocity, and image contrast therefore remain physical constraints. AI can improve interpretation of the image, but it cannot recover particle detail that the optical system never resolved.
What the 2023 Continuous-Milling Study Demonstrated
Madarász and co-workers reported an in-line application of AI-based image analysis for real-time particle-size measurement in continuous pharmaceutical milling.[1] Sodium chloride was used as a model API across a particle-size range of 200 to 1,000 µm.
The measurement system combined a rigid endoscope with a camera and an AI model trained using annotated images of NaCl particles. The important advance was not simply taking photographs inside the process. The trained model was able to detect particles in images containing overlap, allowing the researchers to analyze the process stream without first using dispersion air to separate the particles.
The system was initially evaluated using pre-sifted NaCl fractions and was subsequently installed in a continuous mill. During in-line operation it analyzed approximately 100 particles per second and detected the particle-size reduction produced by the milling process.
The authors reported that the real-time Dv50 values and particle-size distributions correlated well with reference laser-diffraction measurements. They also reported a mean absolute difference below 6% over the measured samples.[1]
That figure belongs to the material, size range and configuration studied. It is not a universal accuracy specification for AI imaging.
Why Agreement With Laser Diffraction Needs Interpretation
Laser diffraction and direct image analysis are based on different measurement principles. Laser diffraction interprets an ensemble scattering pattern through an optical model and reports an equivalent-sphere distribution. Direct imaging measures individual particle projections and derives dimensions from those projections.
The distinction is not academic. Silva and co-workers found different size distributions and different D10, D50 and D90 values when granules and pellets were measured using several in-process and off-line techniques.[2] The authors related those differences to what each instrument physically measured, how size information was calculated and how the resulting distributions were presented.
For an in-line method, numerical identity with laser diffraction is therefore not automatically the correct validation objective. The more useful question is whether the method is sufficiently representative, repeatable and sensitive to the process change or quality attribute it is intended to detect.
For a deeper discussion of why two legitimate particle-sizing methods can return different distributions, see Laser Diffraction and Dynamic Image Analysis: Combined PSD-Shape Interpretation.
The Demonstrated Size Range Matters
<p>The available evidence also needs to be read in the context of particle size. The 2023 continuous-milling study investigated NaCl from 200 to 1,000 µm.<sup><a href=”#source-1″>[1]</a></sup> The subsequent pellet study evaluated fractions between 250 and 850 µm.<sup><a href=”#source-3″>[3]</a></sup></p>
<p>Those studies provide strong evidence for the investigated ranges, but they do not establish equivalent performance for fine pharmaceutical powders well below 200 µm. As particles become smaller, fewer camera pixels represent each particle and the demands on magnification, illumination, optical contrast, depth of field and motion control increase.</p>
<p>The useful lower size limit should consequently be treated as a property of the complete optical and analytical configuration, not as a universal characteristic of AI-assisted imaging. A more capable model cannot compensate indefinitely for insufficient optical resolution.</p>
<p>This is particularly important in milling because the fine fraction may be the part of the distribution most relevant to downstream dissolution, dust formation, cohesion or processability. A system that follows D50 well but progressively loses the finest particles could still provide a misleading process signal.</p>
The 2025 Pellet Study Exposes the Model-Validation Problem
A 2025 study by Péterfi and co-workers extended the concept to pellet layering in a fluid-bed process.[3] The direct-imaging system consisted of a rigid endoscope, light source and process camera operating at 50 frames per second. Instead of merely locating particles, a convolutional neural network performed instance segmentation, producing an outline for pellets judged sufficiently in focus for measurement.
The training dataset contained 500 images with 1,768 manually annotated pellets. The researchers did not evaluate the model only by comparing the final PSD with another instrument. They also assessed the particle-recognition model using precision, recall, F1 score and mean average precision.
The best reported model achieved a precision of 0.689, recall of 0.791 and F1 score of 0.736, with an mAP50 of 0.781 and mAP50-95 of 0.671.[3]
Those values are useful precisely because they are not perfect. They show why AI-assisted particle measurement should not be evaluated only by asking whether a final D50 looks plausible. The model can generate false positives and false negatives while the aggregate PSD still agrees reasonably well with reference measurements.
If the probability of a detection error changes with particle size, the resulting distribution can become biased. A model that disproportionately misses one part of the population may shift the PSD even if the dimensions of correctly detected particles are measured accurately. The training set is therefore part of the measurement method.
From a Two-Dimensional Outline to a Volume-Based PSD
The 2025 pellet work also makes the measurement chain clearer. The CNN returned predicted outlines of detected particles. Those outlines were processed to determine properties including equivalent circular diameter, area, perimeter, circularity and aspect ratio. The equivalent circular diameter was initially calculated in pixels and then converted to micrometers using the calibrated imaging system.[3]
The particle-size comparison was then made using volume-based distributions. The reference techniques measured equivalent spherical diameter, while the imaging system began with a two-dimensional projected outline.
For the near-spherical pellet populations used in the study, that comparison is reasonable and the resulting PSDs corresponded well with dynamic image analysis and laser diffraction. The point becomes more important for irregular powders. Converting information obtained from a two-dimensional projection into a volume-weighted representation necessarily makes particle geometry more consequential.
This is another reason why a Dv50 generated by imaging should not be assumed to be physically identical to a Dv50 generated by laser diffraction merely because both are labeled Dv50. The route from the particle to the reported distribution is different.
Particle Shape Is a Real Advantage of Imaging
That same difference creates one of direct imaging’s strongest advantages. Once a usable particle outline has been extracted, the system can provide more than size alone.
In the pellet study, the researchers evaluated circularity and aspect ratio as well as particle size. Comparison with microscopic image analysis produced an R² of 0.9589 for aspect ratio and 0.8786 for circularity.[3]
The lower agreement for circularity is informative. Circularity is particularly sensitive to perimeter detail, and the researchers attributed part of the difference to the resolution of the manually annotated particle outlines used for AI training.
That illustrates both the opportunity and the limitation. Imaging can generate morphology information that techniques based on ensemble scattering or chord-length measurements cannot provide in the same way. At the same time, the quality of that morphology information depends directly on image resolution and segmentation quality.
Representative Measurement Still Depends on Where the Probe Looks
A highly capable recognition model does not solve a poor sampling location. The camera observes particles within a local field of view, while the process decision usually concerns a much larger material stream or process vessel.
The pellet-layering study provides a useful example. The researchers noted that endoscope position could affect the measurement because lighter particles can move higher in a fluidized bed while heavier and larger particles remain closer to the bottom.[3] The probe was introduced through the fluid-bed system’s designated sampling port, allowing its measurements to represent the material typically sampled from that location during normal operation.
That is a sensible experimental choice, but it exposes a broader engineering requirement: probe location is part of measurement design.
The same problem applies at a mill outlet, on a conveyor, in a gravity chute or within a pneumatic line. A sensor can collect thousands of technically valid individual measurements and still give a biased process picture if the observed location systematically over-represents one part of the particle population.
AI Imaging Is Beginning to Separate Components, Not Just Sizes
A second 2025 study pushed the concept beyond measurement of a single bulk particle-size distribution.[4] Benczúr and co-workers investigated blends containing acetylsalicylic acid and calcium hydrogen phosphate.
The system combined real-time endoscopic imaging with machine vision and artificial intelligence to identify the two powder components. This allowed component-specific particle-size distributions to be determined and compared with microscope reference measurements. The method also provided information about API concentration in the blends.
That matters because a conventional bulk PSD cannot distinguish between two components that happen to occupy different parts of the same distribution. If imaging can reliably identify particle type as well as geometry, a single optical stream can potentially contain information about both size and composition.
The maturity of the evidence must still be kept in perspective. The pharmaceutical processing environment in this study was simulated using a conveyor belt.[4] It is therefore evidence of an emerging measurement capability rather than proof that component-specific PSD and concentration measurement are already established production PAT.
Nevertheless, it shows why AI-based imaging may ultimately become more valuable than simply reproducing a conventional particle-size distribution. The richer opportunity is particle-level process intelligence.
Real-Time Measurement Is Not Yet Closed-Loop Control
An in-line PSD shortens the information delay, but measurement alone does not close the control loop.
In milling, for example, a shift in particle size could potentially be connected to mill speed, screen condition, feed rate or another operating variable. Before an automatic controller acts on that signal, the relationship between the measured attribute, the process state and the manipulated variable needs to be established.
FDA’s Process Analytical Technology framework describes PAT in terms of timely measurement of critical quality and performance attributes with the goal of understanding and controlling manufacturing processes.[5] ICH Q13 similarly addresses the development, implementation, operation and lifecycle management of continuous manufacturing systems and their control strategies.[6]
AI-assisted imaging can form one measurement layer within that strategy. The process-control layer still needs to decide what constitutes a meaningful shift, how quickly the process should respond, how sensor failure or declining image quality is detected, and what happens when incoming material falls outside the conditions represented during method development.
This distinction between sensing, interpretation and process action is explored further in Real-Time Particle Characterization and Process Control.
Six Questions Before Using the Signal for Process Decisions
-
- What particle population is represented in the training data?
Size alone is not enough. Training data should cover relevant particle shapes, surface appearance, overlap, focus conditions, and process backgrounds. - Which particles are most likely to be missed or rejected?
A random detection loss mainly reduces particle count. A systematic loss of fines, coarse particles, or unusual shapes can change the reported distribution. - What is the validated optical measurement range?
The lower and upper useful limits should be demonstrated for the installed camera, magnification, lighting, particle velocity, and field of view rather than inherited from a different AI-imaging study. - Does the field of view represent the process population?
Probe location, segregation, flow pattern and solids concentration determine which particles are actually available to the camera. - How should the result relate to the reference method?
Agreement should be interpreted in the context of the different measurement principles, distribution bases, and particle properties measured by each method. - What process decision follows from the measurement?
A real-time PSD becomes process intelligence only when a defined change in the signal leads to a justified operator response, alarm, investigation or control action.
- What particle population is represented in the training data?
What the Evidence Actually Supports
The evidence has progressed beyond a single laboratory demonstration.
The 2023 continuous-milling work showed that an AI-assisted endoscopic system could analyze overlapping NaCl particles in real time, follow milling-induced size reduction and produce particle-size results that corresponded well with laser diffraction across the investigated 200 to 1,000 µm range.[1]
The 2025 pellet study moved further into process integration. It used instance segmentation to generate particle outlines, explicitly quantified model-detection performance, compared particle-size distributions with dynamic image analysis and laser diffraction, measured particle shape and followed particle growth during an actual fluid-bed layering process.[3]
The component-specific blend study then demonstrated that machine vision and AI can potentially move beyond a single PSD by distinguishing different powder components and extracting information about both component size distributions and blend concentration.[4]
AI makes direct process imaging practical in situations where conventional image analysis struggles, and it opens the possibility of extracting size, shape and particle-identity information from the same process view. Its value depends on the complete measurement chain: optics, training data, particle detection, size calculation, sampling location, reference relationship and the process decision made from the signal.
That is what turns machine vision from an interesting AI demonstration into a process analytical technology.
Sources and Further Reading
Madarász, L., Mészáros, L. A., Köte, Á., Farkas, A., & Nagy, Z. K. (2023). AI-based analysis of in-line process endoscope images for real-time particle size measurement in a continuous pharmaceutical milling process. International Journal of Pharmaceutics, 641, 123060.
Silva, A. F. T., Burggraeve, A., Denon, Q., Van der Meeren, P., Sandler, N., Van Den Kerkhof, T., Hellings, M., Vervaet, C., Remon, J. P., Lopes, J. A., & De Beer, T. (2013). Particle sizing measurements in pharmaceutical applications: Comparison of in-process methods versus off-line methods. European Journal of Pharmaceutics and Biopharmaceutics, 85(3), 1006-1018.
Péterfi, O., Kállai-Szabó, N., Demeter, K. R., Barna, Á. T., Antal, I., Szabó, E., Sipos, E., Nagy, Z. K., & Galata, D. L. (2025). Artificial intelligence-aided endoscopic in-line particle size analysis during the pellet layering process. Journal of Pharmaceutical Analysis, 15(8), 101227.
Benczúr, M., Ficzere, M., Péterfi, O., Kálnai, Á., Nagy, Z. K., & Galata, D. L. (2025). Simultaneous in-line particle size distribution determination of drug and excipient from their powder blend using endoscopic imaging and AI. European Journal of Pharmaceutical Sciences, 215, 107339.
U.S. Food and Drug Administration. (2004). PAT: A Framework for Innovative Pharmaceutical Development, Manufacturing, and Quality Assurance.
International Council for Harmonisation of Technical Requirements for Pharmaceuticals for Human Use (ICH). (2022). Q13: Continuous Manufacturing of Drug Substances and Drug Products. Final version, adopted 16 November 2022.