
Table of contents
Micronization by jet milling is used to produce very fine powders without grinding media, often to increase dissolution rate, improve aerosolization, expose more surface area, or prepare a material for a downstream process. The final particle size is important, but it is not the only property the mill can change.
A micronized lot can pass its particle size distribution specification and still cake faster, take up moisture differently, flow less consistently, disperse differently, or show a changed dissolution profile. When that happens, the useful question is not simply whether the mill hit its D50. The question is whether the milling conditions changed the particle in a way the release PSD does not capture.
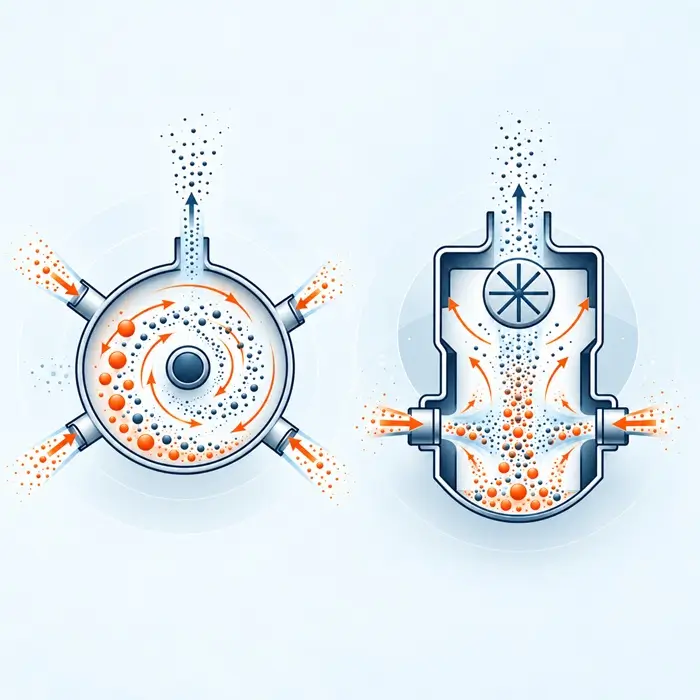
The first step is to identify which jet-mill design is being used, because spiral jet mills and fluidized-bed opposed jet mills classify particles differently.
Jet Mills Do Not All Classify the Same Way
Jet milling uses high-velocity gas to accelerate particles and create repeated particle-particle and particle-wall collisions. Those impacts reduce particle size without conventional grinding media. What happens after breakage, however, depends strongly on the mill configuration.
Spiral Jet Mills: Classification in the Gas Vortex
A spiral, or pancake, jet mill has no moving classifier wheel. Tangential gas jets create a strong vortex inside the milling chamber. Coarser particles experience greater centrifugal effects and remain in the outer grinding region, while sufficiently fine particles are carried by the gas toward the central outlet.
Product fineness therefore depends on the combined effect of grinding gas pressure or flow, solids feed rate, particle properties, and mill geometry, including the chamber and outlet configuration. Midoux et al. showed that grinding pressure and solid feed rate are key operating variables in spiral jet milling, while dedicated aerodynamic-classification work has shown how drag and centrifugal effects govern the cut inside the vortex (Midoux et al., Powder Technology; aerodynamic classification in a spiral jet mill).
Feed rate is therefore not just a throughput setting. Changing particle loading changes the specific energy available per unit mass and can shift the product PSD even when the nominal equipment settings otherwise look unchanged.
Fluidized-Bed Opposed Jet Mills: Dynamic Classification
A fluidized-bed opposed jet mill uses opposing gas jets to accelerate particles into a central collision zone and commonly places a dynamic classifier wheel above the grinding chamber. Particles that meet the classifier cut leave with the gas stream, while coarser particles are rejected and returned to the grinding zone.
Here, classifier wheel speed becomes a direct control on product fineness. Raising the wheel speed generally lowers the cut size, although the final result still depends on gas flow, feed rate, solids loading, particle density, classifier geometry, and the material itself. Work on the Alpine AFG fluidized-bed opposed jet mill demonstrates the central role of the integral classifier in determining product quality (Berthiaux et al., Powder Technology).
The practical distinction is simple: record and interpret the variables that actually control the mill in front of you. For a spiral mill, that means paying particular attention to grinding pressure or gas flow, feed rate, and geometry. For a dynamically classified opposed jet mill, classifier speed becomes an additional critical variable.
Why a Finer Product Can Mean More Than a Smaller Particle
Reducing the cut size usually changes more than the dimensions of the particles leaving the mill. Depending on mill design and operating conditions, a finer target can increase specific energy input, internal residence time, repeated collision history, or the number of breakage events experienced before particles leave the system.
That additional mechanical history can create several different changes. They should not be collapsed into a single explanation.
Fines, Breakage, and Morphology
The most direct effect of more severe milling is further breakage. The fine tail can increase even when D50 changes only modestly, and brittle materials can develop more irregular fracture surfaces. Repeated chipping and attrition can also contribute to fines in materials that are prone to surface damage.
Those changes matter because fines can independently increase cohesion, reduce permeability, alter blend behavior, and change dust release. A downstream flow problem should therefore not automatically be attributed to amorphous content simply because the material has been micronized.
Surface Disorder and Amorphous Content
For some crystalline organic solids, mechanical energy can also disrupt crystalline order near the particle surface while leaving the particle core predominantly crystalline. The amount of surface disorder produced depends on the material, the energy input, temperature, and the cumulative mechanical history.
This matters because the disordered surface can behave differently from the original crystal. Work on milled terbutaline sulfate linked increased moisture sorption to milling-induced surface amorphization rather than simply to newly exposed crystal faces. Controlled humidity conditioning recrystallized that surface amorphous fraction and reduced the moisture response in that specific material (terbutaline sulfate study).
The important point is not that every jet-milled powder becomes meaningfully amorphous. It is that surface state is one possible mechanism when two lots have similar PSDs but different behavior.
Moisture Response and Downstream Behavior
Where surface disorder increases water affinity, the result can appear later as a storage or handling problem rather than as an immediate milling deviation. Increased moisture uptake can contribute to caking, agglomeration, cohesion, or changed wettability and dispersion behavior. The risk depends on the material and its actual humidity and temperature window.
For moisture-sensitive materials, the environmental history after milling matters as much as the release measurement. A surface state created during micronization can evolve during storage, handling, or conditioning.
Four Questions to Ask When a Micronized Lot Changes
When a lot behaves differently, separate the investigation into four questions rather than asking one test to explain everything.
- Did particle size or the fine/coarse tails change? Check the PSD against a known-good lot, not only against the release specification.
- Did morphology or accessible surface area change? Use imaging and surface-area measurements where the failure mode justifies them.
- Did the particle surface or solid state change? Select moisture-sorption, surface-energy, calorimetric, or solid-state methods according to the suspected mechanism.
- Did any of those changes matter in the application? Measure the property that actually failed, such as flow, caking, dissolution, dispersion, aerosolization, or storage stability.
This sequence prevents a common diagnostic mistake: finding one unusual analytical result and assuming it is automatically the root cause of the process failure.
Which Measurements Answer Which Question?
PSD Confirms Size, Not Surface Condition
Particle size distribution testing, commonly by laser diffraction, is the first check on whether the milling process produced the expected D10, D50, D90, span, and distribution tails. Compare the suspect lot with a known-good reference rather than relying only on specification limits.
Two lots can have similar median particle size while differing in fines or oversize. They can also have statistically similar PSDs while differing in surface roughness, accessible area, or surface state. Where particle shape may have changed, dynamic image analysis adds morphology information that laser diffraction alone cannot provide.
BET Surface Area Shows Accessible Area, Not Amorphous Content
Gas adsorption surface-area measurement, commonly reported as BET specific surface area, measures accessible surface area rather than an area inferred from particle diameter. A shift relative to a historical baseline can therefore reveal that the particle surface or structure has changed even when the PSD looks similar.
The interpretation needs discipline. A higher BET result can arise from smaller particles, rougher fracture surfaces, porosity, morphology, or changes in aggregation state. It does not prove that amorphous material is present. BET surface area testing is most useful here when it is compared with the same material, prepared and measured consistently, across known-good and suspect lots.
DVS and Solid-State Evidence
Dynamic vapor sorption directly measures how a powder gains and loses mass as relative humidity changes. It is therefore well matched to the question, “Has micronization changed the material’s moisture response?” For a suitable material and a properly developed method, DVS can also quantify low levels of amorphous content through moisture-induced recrystallization.
A published celecoxib method detected amorphous content down to about 0.3% w/w and reported a quantification limit of 0.9% w/w. Those figures demonstrate what a validated material-specific method can achieve; they are not universal DVS detection limits (celecoxib DVS study).
For a broader introduction to moisture response, see Measuring Hygroscopicity in Food Powders and Moisture as a Formulation Risk.
When Surface Energy or Trace Disorder Is the Question
More specialized methods become useful when the suspected mechanism is specifically a change in the particle surface. Inverse gas chromatography can probe surface-energy characteristics and heterogeneity; it has been used directly to study how micronization changes pharmaceutical particle surfaces (inverse gas chromatography study).
Isothermal microcalorimetry can provide a sensitive route for quantifying low levels of amorphous material when the method and recrystallization conditions are appropriate. Studies on processed pharmaceuticals have shown sensitivity below 1% w/w under suitable conditions (isothermal microcalorimetry review).
These methods are not mandatory additions to every investigation. They are escalation tools when routine size, surface-area, moisture, and performance measurements still leave the mechanism unresolved.
Confirm the Property That Actually Failed
Analytical evidence only becomes useful when it is connected to the observed failure. If the concern is flow, use a shear-cell measurement where consolidation behavior matters, or use Hausner ratio and Carr index as a screening check. PTI’s calculator suite can support quick PSD and flow calculations.
If the problem is storage hardening, investigate moisture sensitivity, caking, and time under load. If dissolution or dispersion changed, test those functions directly. A surface measurement should support the mechanism, not substitute for the performance measurement.
Do Not Ignore Time After Milling
A freshly micronized powder is not necessarily in its final physical state. Residual stress, surface disorder, humidity exposure, recrystallization, fine-particle agglomeration, and other relaxation processes can continue after the material leaves the mill.
The direction of change is material-specific. In one lactose study, specific surface area decreased during storage as humidity promoted redistribution and bonding of fines. In micronized budesonide, specific surface area increased during storage, which the authors linked to post-micronization stress relaxation, crack propagation, and particle fracture (lactose storage study; budesonide storage study).
That makes timing part of the test method. When post-milling instability is plausible, analyze a defined fresh sample and repeat the relevant measurements after a defined storage interval under controlled conditions. Record temperature, relative humidity, packaging or container condition, and elapsed time. A release result without a sample-age definition can hide the very change being investigated.
What Can You Change When the Evidence Points Back to Milling?
Once the failure mechanism is supported by evidence, the corrective action should target the process variable that created it.
For a spiral jet mill, review grinding pressure or gas flow, feed rate, specific energy, feed condition, and any geometry or setup changes. For a fluidized-bed opposed jet mill, add classifier wheel speed, classifier airflow, solids loading, and internal recirculation to that review. For moisture-sensitive products, gas quality, temperature, and moisture or dew-point control may also belong in the investigation.
The correct response is not always to chase the finest possible cut. If the downstream process does not require the additional fineness, backing away from an unnecessarily aggressive milling condition can reduce specific energy and the mechanical history imposed on the material.
Where milling-induced surface amorphization is confirmed, a validated post-micronization conditioning step may be an option for materials that can safely recrystallize under controlled humidity or temperature. The terbutaline sulfate work is a good example of the principle, but conditioning conditions are material-specific and must be established experimentally rather than copied from another product.
Practical Diagnostic Checklist for a Micronized Lot
-
- Identify the mill type. Confirm whether classification is aerodynamic, dynamically classified, or performed in a separate downstream classifier.
- Compare process history. Review feed rate, grinding pressure or gas flow, classifier speed where applicable, temperature, feed condition, and any changes in setup, cleaning, or operating sequence.
- Compare PSDs with a known-good lot. Check D10, D50, D90, span, fines, and oversize rather than treating a specification pass as the end of the investigation.
- Check morphology or accessible surface area when justified. Use imaging and BET to determine whether the particle structure changed in ways the PSD does not show.
- Test the suspected surface mechanism. Use DVS, an appropriate solid-state method, inverse gas chromatography, or isothermal microcalorimetry when moisture response, surface energy, or trace disorder is a credible explanation.
- Measure the failed downstream property. Confirm the effect with flow, caking, dissolution, dispersion, aerosolization, or another application-specific test.
- Add a time point when stability is part of the problem. Repeat the relevant measurements after a defined storage interval under controlled conditions.
- Change the process only after the mechanism is supported. Adjust the relevant milling variables, storage conditions, or a validated conditioning step, then verify that the downstream behavior returns to the expected range.
The goal is not to build the largest analytical panel. It is to connect a changed process condition to a changed particle property and then to the performance problem that matters.
Micronization Process Control & Troubleshooting Guide
A micronized lot can meet its particle size specification and still behave differently in storage or downstream processing. The companion Know How guide turns the principles in this article into a practical investigation workflow. Use it to compare process conditions between batches, identify which measurements can distinguish size, surface, moisture, and flow changes, and decide where further investigation is justified.
The guide includes a process-variable checklist, diagnostic decision tree, cause-and-effect matrix, batch-comparison worksheet, and worked troubleshooting example.