
🔑 Key Takeaway
Laser diffraction reports a particle size distribution based on an equivalent-sphere model, an assumption that becomes an interpretation risk once particle shape departs from roughly spherical. Instruments that run dynamic image analysis alongside laser diffraction in the same measurement add per-particle shape descriptors, aspect ratio, circularity, convexity, that can explain why a D50 or D90 looks inconsistent with what a process team observes. The combined output still relies on finite image statistics and a projected two-dimensional view of each imaged particle, so it supports interpretation rather than replacing a dedicated morphology study.
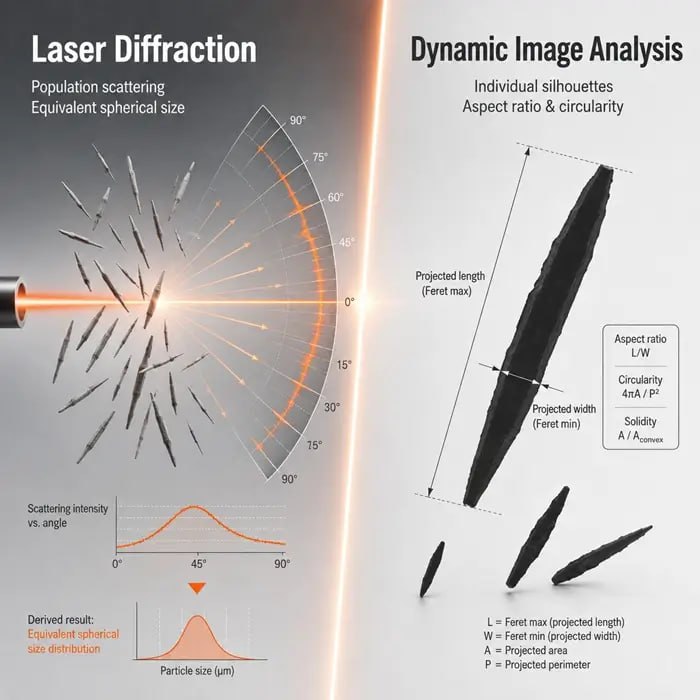
Laser diffraction has been the default volumetric particle size method for decades because it is fast, repeatable on a well-dispersed sample, and covers a wide size range in one measurement. What it cannot do is tell an operator what an irregular or fibrous particle actually looks like, because the method derives a particle size distribution from the scattering response using an equivalent-sphere model. Commercial systems are now available that run dynamic image analysis alongside laser diffraction in a single measurement cycle, capturing per-particle shape data on the same dispersed sample used for the scattering measurement.
That pairing does not change what laser diffraction measures. It adds a second, independent data stream that can explain why a particle size distribution shifted in a way that does not match sieve data, flow behavior, or visual inspection. This insight looks at the mechanism gap laser diffraction leaves for non-spherical particles, what shape descriptors from imaging add when a D50 or D90 looks anomalous, and where a combined result still stops short of a dedicated shape or morphology study.
The Equivalent-Sphere Assumption Behind a Laser Diffraction Result
Laser diffraction works by matching the light-scattering pattern produced by a particle population to the pattern predicted for a population of spheres, using the optical models described in ISO 13320. Every reported value, D10, D50, D90, or the full distribution, is expressed as an equivalent-sphere diameter: the diameter of a sphere that would produce the same scattering response as the measured particle, independent of that particle’s actual geometry.
For roughly equant particles, close to spherical or blocky, this convention introduces limited distortion. For elongated, plate-like, or fibrous particles, the equivalent-sphere diameter can fall well below the particle’s longest dimension and above its narrowest one, folding three-dimensional shape into a single number. The reported D50 or D90 stays internally consistent and reproducible between runs, but it no longer describes a shape the operator can visualize, which is where interpretation can start to drift from what is actually happening in the process.
What Dynamic Image Analysis Adds to an Anomalous D50 or D90
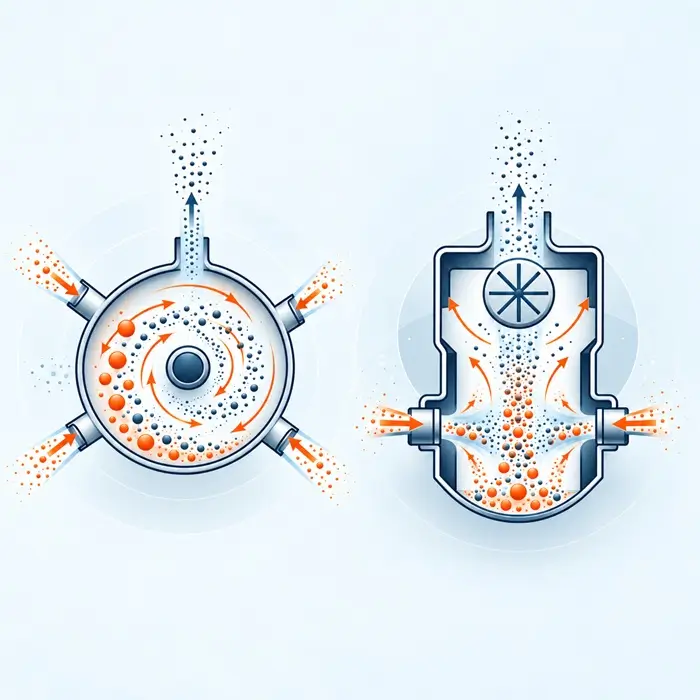
Dynamic image analysis captures individual particle silhouettes as they pass through an imaging zone and calculates size and shape descriptors directly from each projection, following the general framework in ISO 13322-2. Aspect ratio, circularity, convexity, and elongation are calculated per particle rather than inferred from a bulk scattering pattern. When a laser diffraction D50 shifts unexpectedly between batches, or a D90 grows without a matching change in sieve retention, the shape descriptors from a paired imaging run can indicate whether the shift reflects a genuine size change or a shape change that laser diffraction is reporting as an equivalent-sphere artifact.
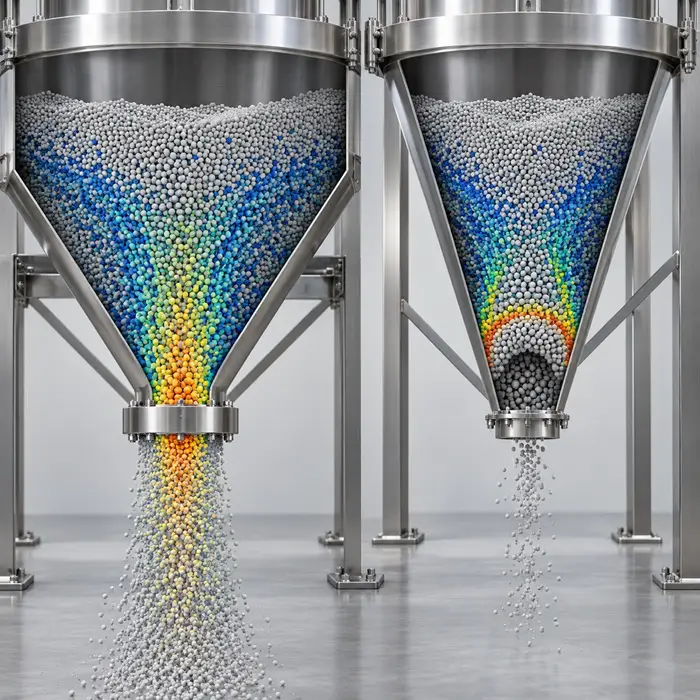
A batch that develops a longer tail of needle-like fragments after milling, for example, can show a rising D90 in laser diffraction while the imaging channel shows the median particle becoming more elongated rather than the coarse fraction genuinely growing. That distinction matters for a process decision: a milling adjustment aimed at reducing coarse particles will not address a shape change, and a specification written only against D90 will not catch the difference. Reading the shape signal alongside how particle shape influences flow behavior connects the imaging output to a practical handling consequence rather than treating it as an isolated number.
Where a Combined Result Still Falls Short of a Dedicated Morphology Study
A paired laser diffraction and dynamic image analysis run improves interpretation, but it does not resolve every limitation of either technique on its own. Laser diffraction measures an ensemble scattering pattern, whereas the imaging channel captures and classifies a finite population of individual particles during the same run. A comparison of laser diffraction and image analysis on additive manufacturing powders found that disagreement between the two methods increased as particle morphology departed from spherical, and that disparities persisted even when both measurements were run on the same dispersed sample (Powder Technology). A combined output is a stronger diagnostic pairing, not a fully reconciled single result.
The imaging channel in most combined systems also reports a two-dimensional projection per particle, captured from whatever orientation the particle presents as it passes the camera, so it does not directly capture internal porosity, surface texture, or a true three-dimensional aspect ratio. A small but process-relevant population, such as a minor fraction of severely elongated fragments, can also fall below the particle count needed for a statistically stable shape distribution in a routine run. Where internal porosity, surface texture, or a defensible three-dimensional shape characterization is the actual question, SEM-based morphology analysis or X-ray micro-CT remain the more direct route, with the combined PSD-shape result serving as the screening step that indicates whether that deeper study is warranted.
Practical Interpretation Checklist
Before treating a shifted D50 or D90 as a size change, verify whether the aspect ratio or circularity distribution moved in the same batch comparison. A simultaneous shape shift can indicate fragmentation, attrition, deformation, agglomerate breakup, or another change in particle morphology rather than straightforward coarsening or fines generation alone.
Compare the particle count behind the imaging-based shape distribution to the size of the coarse or fine tail under investigation. A rare particle population needs enough imaged particles behind it to support a conclusion, and a combined run on a small dispersed aliquot can undercount it.
Treat the combined result as a decision input alongside fines content and flow behavior data, not as a standalone verdict. A shape change identified through imaging still needs to be connected to the actual process symptom, feeder variability, screen blinding, or a flow function change, before it drives an equipment or process change.