- Key takeaway
- Why blend uniformity does not guarantee content uniformity
- What NIR-embedded segregation testing measures
- Connecting segregation profiles to particle-size measurements
- Predicting segregation risk from powder properties
- Turning diagnostic results into formulation decisions
- Confirming the diagnosis during manufacturing
- Choosing the next experiment
- Conclusion
- Frequently Asked Questions
- Technical Basis / Sources
- Related Reading
- About the Author: Martijn Daalder
- Related Posts
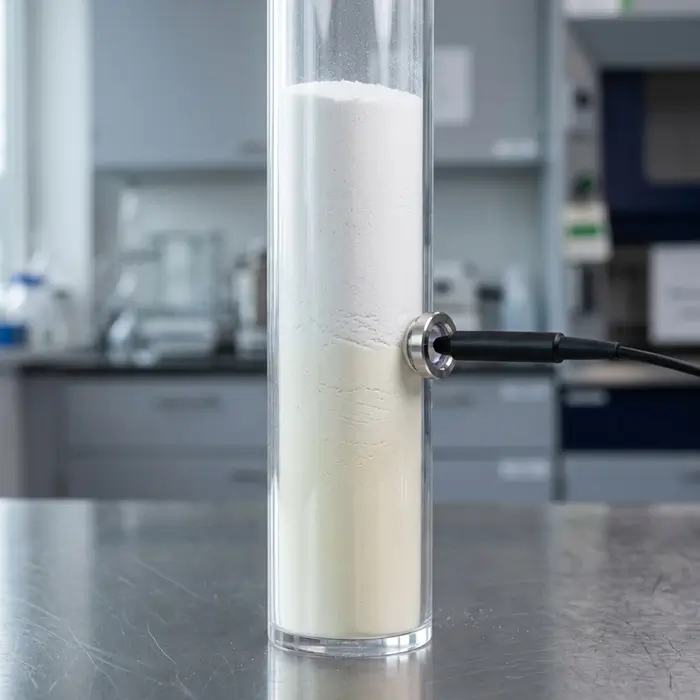
A pharmaceutical blend passes its uniformity test at the mixer. Yet tablets manufactured from the same batch show unacceptable variation in active pharmaceutical ingredient (API) content. Mixing appears satisfactory, but somewhere between blending and compression, the distribution of the API has changed.
For formulation scientists, this raises two questions: where does the blend lose uniformity, and which material properties contribute to that separation? The answers determine whether the next experiment should focus on particle size, excipient selection, mixing conditions, or powder handling.
Near-infrared (NIR) segregation testing provides a way to investigate these questions before committing to production-scale changes. Recent research has also explored whether measurable powder properties can predict segregation susceptibility during formulation development.
Why blend uniformity does not guarantee content uniformity
Blend uniformity describes the material at a particular stage of production. It does not establish that the same composition will survive subsequent handling.
Vibration can allow smaller particles to percolate between larger ones. Free-fall and heap formation can separate components according to their trajectories, while aeration can redistribute fine particles. Particle size, density, shape, and cohesion influence these mechanisms, as explained in PTI’s powder segregation diagnosis guide and analysis of segregation during chute transfer.
Pharmaceutical formulations introduce an additional concern. When an API represents only a small fraction of the blend, relatively modest redistribution can produce important differences in dosage-unit composition. The bulk powder may look unchanged even though API concentration varies between locations or over time.
The investigation must connect changes in powder composition to the manufacturing stage at which they occur. A laboratory segregation result becomes useful when it helps explain a variation that matters for the final tablets.
What NIR-embedded segregation testing measures
Conventional segregation testers expose a powder blend to a controlled disturbance, followed by sampling and analysis. An NIR-embedded tester combines these operations by measuring composition at defined positions within the powder bed. With an appropriate calibration, NIR spectra provide estimates of API concentration, yielding a spatial profile rather than one average value.
Desai and colleagues demonstrated this approach in 2020 using two GlaxoSmithKline pharmaceutical product blends with variations in API particle size and concentration [1]. The researchers applied vibration and fluidization, then measured drug content at different locations to evaluate segregation intensity and distribution.
Segregation susceptibility depended on both the particle sizes of the formulation components and the disturbance applied. The researchers interpreted the concentration profiles in terms of sieving, trajectory segregation, and air elutriation. Their results show how controlled testing can help identify the mechanisms contributing to instability, rather than merely establish that segregation occurred.
Reading the concentration profile
Consider a formulation that develops an API-rich lower layer after vibration. If the API particles are considerably smaller than the surrounding excipients, downward percolation becomes a plausible explanation. The profile identifies the direction and extent of redistribution, while particle-size measurements support the proposed mechanism.
Another formulation may develop a stronger gradient under fluidization. In that case, differences in aerodynamic behavior, particle density, and fine-particle mobility deserve closer examination. However, the diagnostic interpretation needs an important qualification.
Desai and colleagues described their concentration profiles as enabling identification of underlying segregation mechanisms in their blends. That conclusion is useful within their experimental setting, but it should not be generalized to mean every concentration gradient uniquely identifies a mechanism. Different particle properties and disturbances can produce overlapping patterns. Trajectory segregation, for example, may require a dedicated deposition or free-fall experiment.
The strongest diagnosis combines the concentration profile, the applied disturbance, and independent characterization of the formulation components.
Calibration and measurement scale
NIR spectroscopy does not measure API concentration independently of its calibration model. Particle size, packing density, moisture, and sample presentation can influence the spectral response. A calibration developed for one formulation may not remain valid after an excipient-grade change, particularly when scattering changes.
Bakri and colleagues compared real-time NIR blend monitoring with stratified sampling, HPLC, and NIR chemical imaging [2]. Their results showed that the approaches could agree on blend endpoint determination, while differences in reported concentration and variability were partly associated with effective sample size and sampling errors.
The volume interrogated by NIR is not necessarily equivalent to the quantity collected by a sampling thief or entering a tablet die. Quantitative testing therefore needs a calibration representative of the expected API concentration range and relevant physical variation, supported by independent reference assays. The European Medicines Agency’s NIR guideline addresses calibration, validation, and the scope of pharmaceutical NIR procedures [3]. Its requirements apply according to the method’s intended use.
Connecting segregation profiles to particle-size measurements
Once a concentration gradient has been established, particle-size distribution (PSD) provides an important part of the physical explanation. Laser diffraction, performed according to ISO 13320:2020, can characterize API and excipient size distributions [4]. It commonly reports a volume-based distribution derived from light scattering and an optical model.
D10 represents the fine side of the distribution, D50 its median, and D90 the coarse side. The ratio D90/D10 describes distribution width, while the complete curve reveals populations and tails that individual percentiles can conceal.
Two excipient grades may have similar D50 values but different fine-particle populations. Likewise, an API may have a median size close to its primary excipient while differing substantially in distribution width. These differences can influence rearrangement during vibration and flow. PTI’s particle-size distribution interpretation guide explains how to read the descriptors together.
Measurement conditions matter. Wet dispersion may alter agglomeration or dissolve susceptible materials, while dry dispersion may disrupt weak agglomerates. The chosen procedure should characterize a defined particle state relevant to the investigation.
Why size distribution is not enough
Laser diffraction cannot independently establish whether segregation is driven primarily by particle density. Components with similar size distributions can respond differently to vibration and fluidization because their densities, shapes, surface properties, or cohesion differ.
A broader investigation may require particle-density measurements, flowability testing, morphology analysis, or cohesion assessment. Particle density and bulk density must not be confused: bulk density depends on packing and is not a direct substitute for the density of individual particles.
When a substantial size mismatch coincides with vibration-induced separation, sifting becomes a reasonable working hypothesis. If the size distributions overlap closely but strong segregation persists, other material properties and handling conditions deserve investigation.
Predicting segregation risk from powder properties
Segregation testing provides experimental evidence, but formulation scientists often need to compare candidate formulations before larger material quantities are available. This creates an opportunity for screening from routinely measured powder properties.
Li and colleagues examined this approach in a 2025 study of acetaminophen and ibuprofen sodium formulations containing combinations of microcrystalline cellulose, lactose, pregelatinized starch, and mannitol [5]. Drug loadings ranged from 2% to 10%. Segregation was assessed using a modified Jenike & Johanson tester, with NIR spectroscopy providing content analysis.
Their analysis identified four significant descriptors: median particle size (D50), particle-size distribution width (D90/D10), the flowability ratio between API and blend, and the particle-size-distribution-width ratio between API and blend.
The distinction between individual properties and ratios matters. Segregation depends not only on the characteristics of an API but on how those characteristics compare with the surrounding formulation. An API that behaves satisfactorily with one excipient grade may segregate more readily with another. The researchers developed two composite powder-property indices and evaluated their predictive performance using commercial blends.
Using predictive indices appropriately
These indices can help formulation teams rank excipient options, calculate descriptors according to the published method, and prioritize promising blends for testing before larger-scale experiments become practical.
However, the indices are empirical relationships developed within specific material and experimental ranges. Their performance cannot be assumed for substantially different materials, drug loadings, or complex multicomponent systems without confirmation. Use them to prioritize controlled experiments, not as universal segregation acceptance limits.
Turning diagnostic results into formulation decisions
Different segregation mechanisms call for different interventions. A size mismatch that promotes percolation presents a different problem from API redistribution during an aerated transfer. The objective is to change the implicated material or process variable without compromising other formulation requirements.
When particle-size mismatch dominates
Reducing API particle size is not automatically beneficial. If the API is already much finer than the excipients, further micronization may increase the size mismatch or alter cohesion and flow. A different excipient grade may offer a more appropriate starting point.
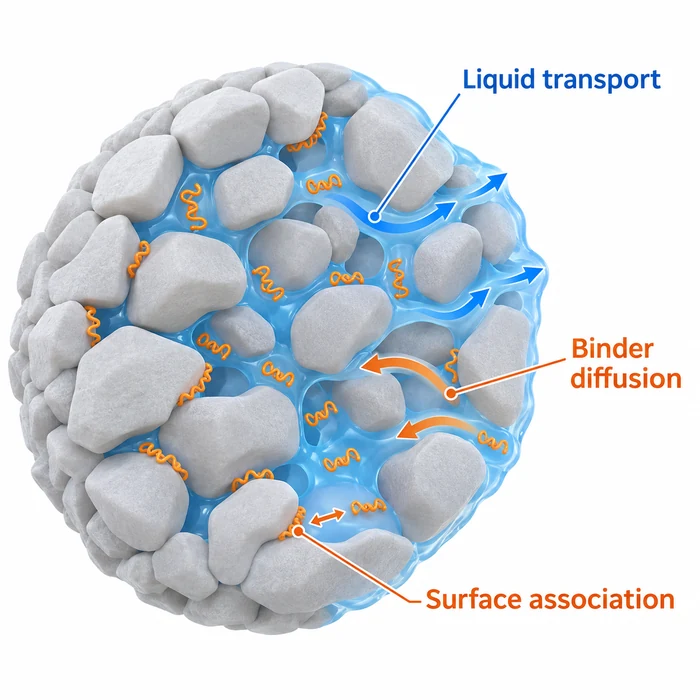
Ordered or adhesive mixing is another option. In suitable formulations, fine API particles attach to larger carriers, limiting independent movement. Their association must remain stable under downstream handling; apparent uniformity immediately after mixing is not sufficient proof.
What microcrystalline cellulose studies demonstrate
Two Nakamura studies from 2019 show why excipient grade, particle size, concentration, and mixing conditions must be evaluated together.
In the first, published in AAPS PharmSciTech, the researchers investigated MCC concentrations of 0%, 10%, and 20% with premixing times of 5, 15, and 25 minutes [6]. MCC slightly reduced powder flowability but increased tablet hardness and shortened disintegration time. Mixing for at least 15 minutes reduced drug-content variation under the tested conditions.
Response-surface analysis identified a design space of 6.5–8.5% MCC and 19–24 minutes of mixing. Within the authors’ modeled region, the study’s limits for hardness, disintegration, and drug-content variation could be satisfied. Those figures describe a formulation-specific design space, not a general optimum.
A separate study in the Journal of Drug Delivery Science and Technology investigated fine MCC as a segregation inhibitor [7]. It compared formulations containing acetaminophen of different particle sizes. Fine MCC reduced drug-content variation, with a more pronounced effect for the larger-particle API formulation. Conventional MCC did not produce the same improvement in that comparison.
These results demonstrate why an excipient’s grade and interparticle interactions matter alongside its nominal amount. Any formulation improvement must also preserve required flow, compaction, disintegration, and other product properties.
When handling conditions dominate
If segregation occurs mainly during aerated transfer, changing excipient composition may be unnecessary. Reducing excess aeration, changing transfer geometry, or modifying receiver filling conditions can reduce opportunities for separation.
Similarly, a blend stable during vibration testing but unstable during free-fall deposition may benefit more from changing the filling arrangement than from additional mixing. Select the intervention from evidence of where composition first changes, then repeat the test under controlled conditions.
Confirming the diagnosis during manufacturing
A laboratory segregation test applies a defined disturbance. Manufacturing subjects the blend to a sequence of operations with different geometries, stresses, and durations. Laboratory segregation intensity therefore does not automatically predict finished-tablet variation.
Wahl and colleagues installed an inline NIR probe in the feed frame of an industrial tablet press [8]. Their measurements identified segregation toward the end of production, and analysis of collected tablets supported the observation. Composition can change as the powder inventory decreases, even when earlier production stages appear satisfactory.
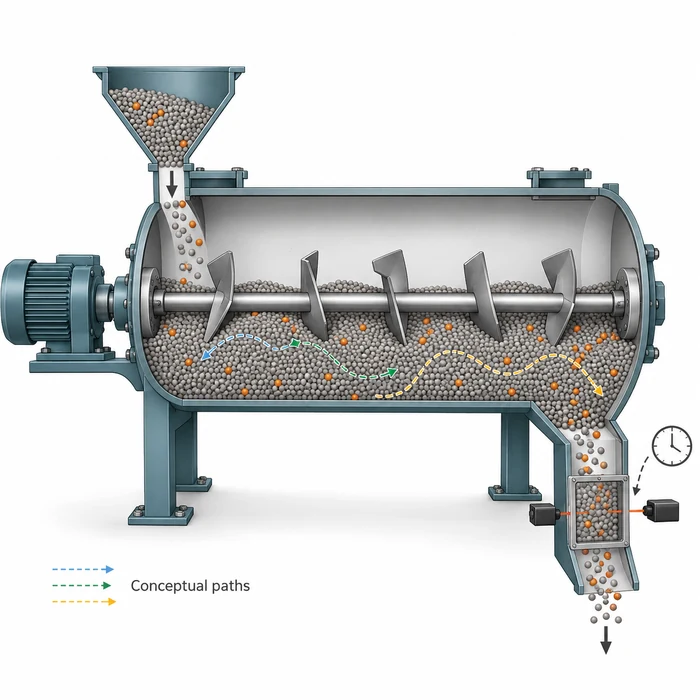
To determine whether laboratory findings transfer to production, sample before and after the operations most likely to redistribute the API, including transfer, hopper discharge, and tablet feeding. Early, middle, and late discharge measurements can reveal temporal concentration changes concealed by a composite sample.
Sampling procedures must also match the intended measurement scale. PTI’s representative powder sampling guide explains why sample location, mass, and collection method govern the reliability of such comparisons.
Finally, connect measured powder behavior with dosage-unit results. A change that improves a laboratory segregation index without improving tablet content uniformity has not yet demonstrated the required manufacturing benefit.
Choosing the next experiment
A useful segregation investigation identifies a defensible next action. When controlled vibration produces an API gradient supported by a substantial size mismatch, compare suitable API or excipient size distributions and repeat the test under matched conditions.
If fluidization gives the stronger response, investigate properties governing aerodynamic behavior and examine transfer steps that entrain air. A handling modification may be more appropriate than reformulation.
If neither laboratory disturbance reproduces the manufacturing problem, examine actual process geometry and operating sequence. Hopper discharge, feeder operation, and intermittent refilling can create separation patterns absent from bench-scale tests.
Evaluate the selected intervention against both segregation behavior and applicable product-quality requirements.
The goal is not simply a lower segregation score. It is to demonstrate that the selected formulation and process maintain the required API distribution throughout manufacturing.
Conclusion
NIR-embedded segregation testing reveals how API concentration changes under controlled disturbances, while particle-size characterization and predictive indices help identify suitable formulation and process adjustments. Together, these methods allow scientists to investigate segregation before it becomes a manufacturing deviation. The final test is whether those adjustments maintain dosage-unit uniformity throughout production.
Frequently Asked Questions
Technical Basis / Sources
- [1] Desai, P. M.; Acharya, S.; Armstrong, C.; Wu, E. L.; Zaidi, S. A. M. (2020). Underpinning mechanistic understanding of the segregation phenomena of pharmaceutical blends using a near-infrared (NIR) spectrometer embedded segregation tester. European Journal of Pharmaceutical Sciences, 154, 105516.
- [2] Bakri, B.; Weimer, M.; Hauck, G.; Reich, G. (2015). Assessment of powder blend uniformity: Comparison of real-time NIR blend monitoring with stratified sampling in combination with HPLC and at-line NIR Chemical Imaging. European Journal of Pharmaceutics and Biopharmaceutics, 97, 78–89.
- [3] European Medicines Agency. Guideline on the use of near-infrared spectroscopy by the pharmaceutical industry and the data requirements for new submissions and variations. EMEA/CHMP/CVMP/QWP/17760/2009 Rev. 2.
- [4] ISO 13320:2020. Particle size analysis: Laser diffraction methods. International Organization for Standardization.
- [5] Li, J.; Vyas, Z.; Weiler, C.; Tseng, Y.-C.; Paul, S. (2025). Novel powder property-based indices for predicting segregation risk in multicomponent pharmaceutical blends. International Journal of Pharmaceutics, 682, 125990.
- [6] Nakamura, S.; Tanaka, C.; Yuasa, H.; Sakamoto, T. (2019). Utility of Microcrystalline Cellulose for Improving Drug Content Uniformity in Tablet Manufacturing Using Direct Powder Compression. AAPS PharmSciTech, 20, 151.
- [7] Nakamura, S.; Nakagawa, M.; Tanaka, C.; Yuasa, H.; Sakamoto, T. (2019). Utility of microcrystalline cellulose to prevent drug segregation in direct powder compression. Journal of Drug Delivery Science and Technology, 52, 386–392.
- [8] Wahl, P. R.; Fruhmann, G.; Sacher, S.; Straka, G.; Sowinski, S.; Khinast, J. G. (2014). PAT for tableting: Inline monitoring of API and excipients via NIR spectroscopy. European Journal of Pharmaceutics and Biopharmaceutics, 87(2), 271–278.