
🔑 Key Takeaway
Bulk fertilizer plants handle straight materials that differ in particle size, particle density, hygroscopicity, and granule strength, but chemical compatibility comes first: urea and ammonium nitrate, for example, are not a normal dry-blend pair. Segregation, caking, and dust therefore require different diagnostics, including SGN and UI for size compatibility, blend CRH for moisture sensitivity, granule strength and abrasion resistance for fines generation, and EN 15051 for dustiness.
Table of contents
Bulk blending remains one of the most cost-effective ways to deliver a custom N-P-K ratio. Selected, chemically compatible straight granular materials are mixed mechanically rather than chemically combined into a single granule. Common raw materials include urea, ammonium nitrate, diammonium phosphate, and muriate of potash, but their use in the same industry does not mean every pair can be dry blended. This approach keeps formulation flexible for different crops and regions while retaining the distinct physical properties of each component.
Segregation, hygroscopic caking, and dust release can all arise from those differences, but through distinct mechanisms. Particle size and density influence how a blend reorganizes during handling. Moisture sensitivity and temperature history affect storage stability, while attrition and transfer conditions influence fines generation and dust release. This article connects each failure mode to the test best suited to diagnosing it, rather than treating flowability as a single catch-all check.
What Bulk Fertilizer Blending Puts at Stake
Uniformity at the mixer discharge is only the starting point. Every subsequent transfer, hopper discharge, and drop onto a pile creates an opportunity for the components to redistribute by particle size, shape, and particle density. The commercial consequence is uneven nutrient distribution: a bag or spreader pass can contain more nitrogen-rich granules in one location and more potassium-rich granules in another, even though the certificate of analysis for the full batch is correct.
Caking and dust are compounding risks layered on top of segregation. A caked blend resists free discharge from storage and bagging equipment, and the mechanical force needed to break up a caked mass often generates the fines and dust that create a separate handling and exposure problem. None of these three failure modes is unique to fertilizer, but the combination of hygroscopic straight materials, differences in particle properties, and high-throughput handling makes fertilizer blending a useful case study in how particle size distribution, moisture sensitivity, and granule integrity interact in one process.
Representative Physical Properties of Common Fertilizer Straights
| Material | Apparent granule density (g/cm³)* | Typical loose bulk density | Representative SGN | Reference CRH at 30°C** |
|---|---|---|---|---|
| Granular urea | ~1.22–1.33 | 700–800 kg/m³ | ~290 | 72.5% |
| Ammonium nitrate | ~1.29–1.65, depending on prill or granule grade | 800–1,000 kg/m³ | ~200–300, grade-dependent | 59.4% |
| DAP | ~1.62 | 900–1,100 kg/m³ | ~300 | 82.5% |
| MOP (KCl) | ~2.0 | 1,000–1,200 kg/m³ | ~300 | 84.0% |
* These are representative values, not procurement specifications. Apparent granule density can differ substantially between manufacturing routes and grades, particularly for ammonium nitrate. For segregation analysis, use data for the actual commercial product rather than crystal density or a generic material value.
** CRH values are reference values for the individual salts at 30°C. Commercial grades, coatings, impurities, and especially blending can change the actual value. CRH should not be treated as a compatibility approval for a blend.
Segregation in Bulk Blends: Particle Size and Density Effects
Several distinct segregation mechanisms can act during fertilizer handling. During pile formation, smaller particles can percolate through voids between larger particles and concentrate nearer the center or base of the pile. Larger or more mobile particles can also roll or avalanche down the pile surface and accumulate toward the perimeter.
Trajectory segregation is different. It occurs while particles are in free flight from a belt, chute, or other transfer point. Differences in particle size, apparent particle density, shape, and velocity can cause components to follow different trajectories and land in different parts of the receiving pile.
These mechanisms can occur together, but they should not be treated as interchangeable. Studies of blended fertilizer identify particle-size differences as a major segregation driver, with particle density, shape, drop height, belt speed, and transfer geometry influencing how strongly that potential appears in practice (documented segregation behavior of blended fertilizer particles).
Why Matched Granule Size Alone Doesn’t Guarantee a Uniform Blend
Fertilizer blenders normally describe particle-size compatibility using Size Guide Number (SGN) and Uniformity Index (UI), rather than relying only on a nominal sieve cut. SGN represents the median particle size, expressed as 100 times the d50 in millimeters. UI expresses distribution width as the particle size at 95% retained divided by the size at 10% retained, multiplied by 100. A common working approach is to keep the SGN and UI of the component materials within roughly ±10% of the blend average.
EN 1235 provides the fertilizer-specific method for determining particle size distribution by test sieving. Comparing SGN and UI derived from sieve data gives a practical first check on whether the straight materials are physically compatible for blending.
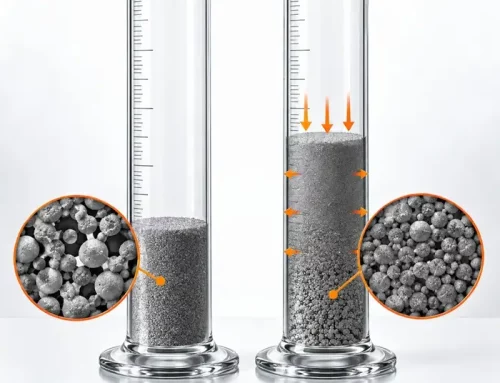
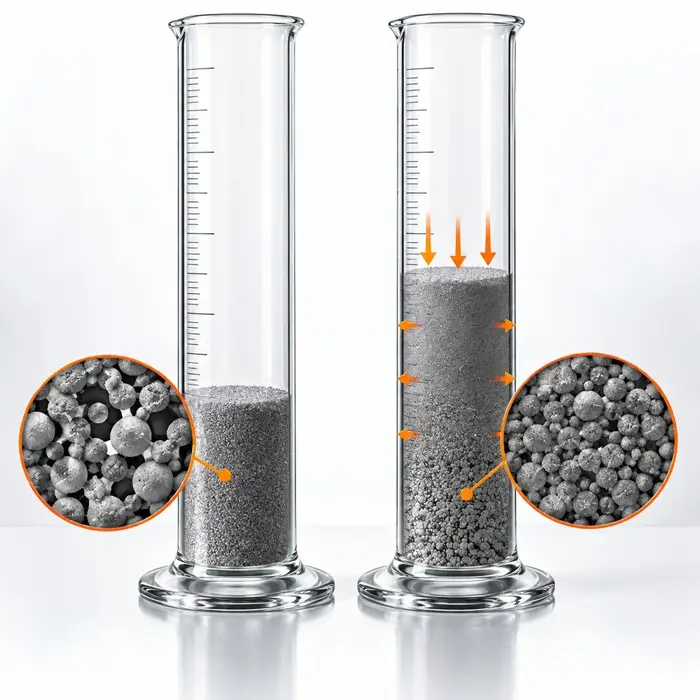
Matching size distributions reduces segregation risk but does not eliminate it. Granules with similar diameters can still differ in apparent particle density and shape, which changes their mass, momentum, rolling behavior, and response during transfer. Bulk density describes a bed of particles, including the void space between them; it is not a substitute for particle-level density when diagnosing segregation. For broader context, see why bulk density alone can be a misleading basis for comparison.
Hygroscopic Caking and Compatibility: Urea and Ammonium Nitrate
Urea and ammonium nitrate are both hygroscopic fertilizers. Reference data at 30°C give critical relative humidities of about 72.5% for urea and 59.4% for ammonium nitrate. The temperature dependence of ammonium nitrate CRH is documented in classic work on the mechanism of ammonium nitrate prill caking. Those individual values, however, do not describe what happens when the two materials are brought together.
Why Blend CRH Can Fall Below Either Component
The urea-ammonium nitrate pair is the extreme example of mixture-induced CRH depression, and it should not be presented as a normal dry bulk blend. At 30°C, the reference mixture CRH reported for the urea-ammonium nitrate pair is only about 18.1%, compared with about 59.4% for ammonium nitrate and 72.5% for urea (IFDC fertilizer bulk blending guide). Fertilizer compatibility guidance therefore classifies the pair as unsuitable for conventional dry blending.
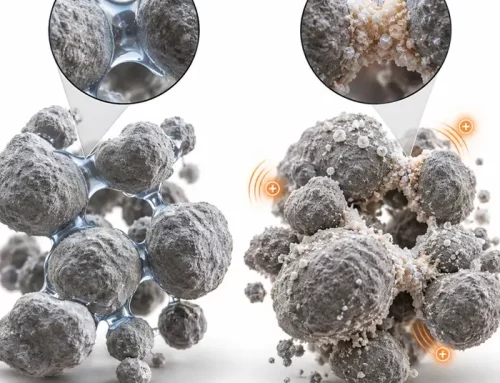
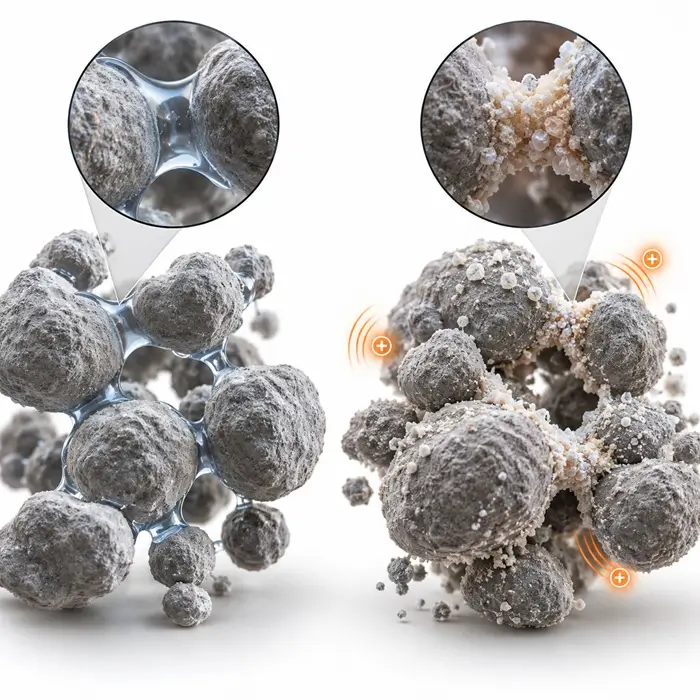
That extreme case demonstrates the mixture-CRH principle. Moisture at contact points between hygroscopic salts can create a concentrated solution phase whose equilibrium vapor pressure is lower than that of either individual component. A mixture can therefore begin taking up atmospheric moisture under conditions where the separate materials would remain dry.
For compatible fertilizer blends, the actual CRH still depends on composition, grade, coatings, impurities, and temperature. Formulation measures such as anti-caking coatings can also influence storage behavior. Measuring the real blend can therefore provide a more useful basis for storage and handling decisions than relying only on CRH values for the individual straights. The urea-ammonium nitrate case, however, is a compatibility warning rather than simply a blend that requires a tighter warehouse humidity specification.
Temperature Cycling and the Ammonium Nitrate Phase Transition
Ammonium nitrate adds a temperature-driven mechanism on top of moisture-related caking. Its crystal structure can undergo a solid-state phase transition near 32°C, from form IV to form III on heating. The transition produces an increase in specific volume of approximately 3.6%. Repeated cycling through this temperature range can therefore weaken prills, promote cracking, and increase fines generation (the ammonium nitrate III–IV phase transition).
The exact transition behavior depends on factors such as moisture content, thermal history, additives, and product formulation. For troubleshooting, the practical question is whether the product repeatedly crosses a temperature range in which phase changes reduce granule integrity.
That distinction matters because a warehouse can show acceptable humidity while temperature cycling still contributes to caking or friability. In that case, temperature management or phase stabilization may matter more than dehumidification alone. Background on moisture-driven caking is covered in dew point and water activity control for caking-prone powders and in the distinction between a caking problem and a compaction problem.
Ammonium nitrate also has a separate safety and regulatory dimension. Combustible contamination must be tightly controlled. In the EU, high-nitrogen ammonium nitrate fertilizers containing at least 28% nitrogen from ammonium nitrate are subject to specific composition, thermal-cycling, oil-retention, and detonation-resistance requirements. Ammonium nitrate above the applicable 16% nitrogen threshold is also regulated as a restricted explosives precursor for members of the general public. These requirements sit outside the powder-behavior tests discussed here but must be considered when handling or formulating ammonium nitrate-containing products.
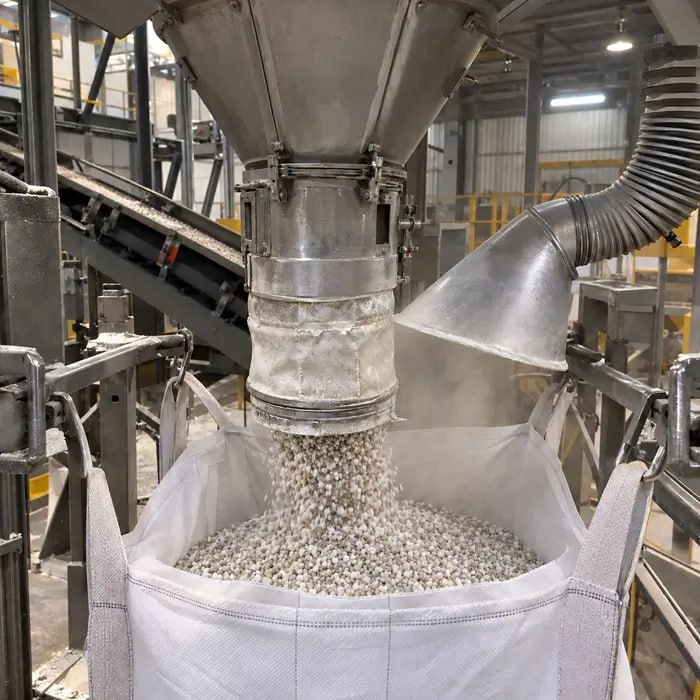
Dust Generation During Bagging and Transfer
Dust at a fertilizer bagging line depends on the fines already present, the severity of transfer, and the mechanical integrity of the granules. Crushing strength indicates how readily individual granules fracture under load, while abrasion resistance indicates how readily their surfaces degrade and generate fines during repeated contact and handling. IFDC includes procedures for both properties in its fertilizer physical-properties methodology.
Weak or abrasion-sensitive granules can therefore enter the bagging line with a growing fines fraction after conveying, storage, and repeated transfer. Where ammonium nitrate is present, thermal cycling can further weaken granules and add to this degradation.
Electrostatic charging affects what happens to those fines after they form. Charged particles may cling to bag interiors and equipment surfaces rather than settle normally, increasing deposits and housekeeping problems. Fines generation, airborne dust release, and electrostatic deposition are related problems, but they are not the same mechanism. General mechanisms are covered in electrostatic troubleshooting in powder handling.
Matching the Failure Mode to a Relevant Test
None of the three failure modes above is diagnosed well by a single generic flowability check. Each maps to a specific measurement that addresses the underlying mechanism rather than a downstream symptom.
Segregation Potential: Sieve and Image Analysis
Start by determining the particle size distribution of each straight material. EN 1235 provides the fertilizer-specific test-sieving method, and the resulting distributions can be converted into SGN and UI values for direct comparison between blend components. For fertilizer-specific guidance on SGN and UI, see the IFDC fertilizer bulk blending guide.
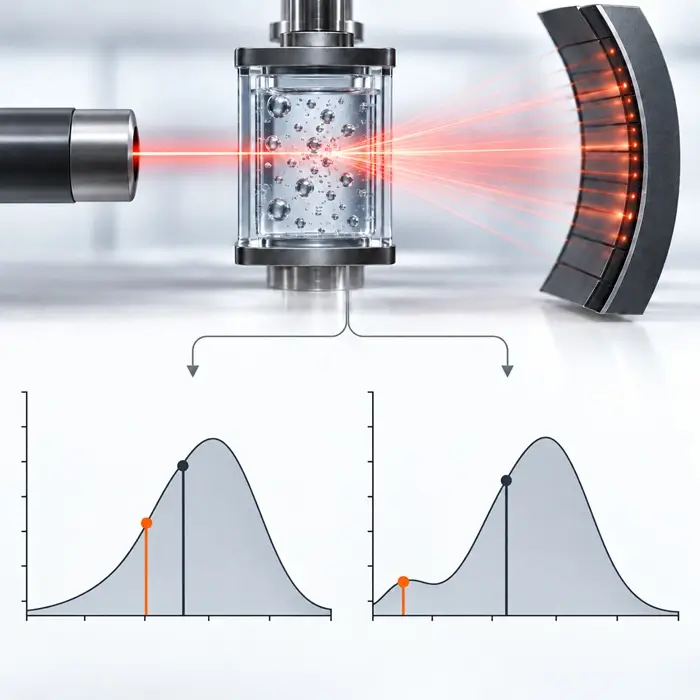
Dynamic image analysis can add particle-shape information that sieving cannot provide. If components are closely matched in SGN and UI but segregation remains a concern, apparent particle density and shape become important additional variables. For more on combining size and shape measurements, see when laser diffraction and dynamic image analysis are run together and particle size distribution interpretation.
A practical bench test such as the bottle segregation test can then show how readily the proposed blend separates under a defined disturbance. These measurements indicate segregation potential rather than guarantee plant performance. Drop height, transfer geometry, belt speed, pile formation, and filling conditions can still change the outcome. For the process side of that assessment, see powder segregation diagnosis during mixing, conveying, and filling.
Caking Risk: Critical Relative Humidity Testing
Measure the critical relative humidity of the actual blend when moisture-driven caking is suspected. Published values for the individual straight materials may not represent the mixture because interactions between components can shift the threshold substantially.
The result shows whether current or seasonal storage conditions approach the humidity at which moisture uptake becomes likely. This can support decisions about dehumidification, stock rotation, packaging, or anti-caking treatment.
Critical relative humidity is only one part of the caking assessment. Storage duration, temperature history, mechanical load, and the extent of humidity cycling can also influence how quickly caking develops. Related testing approaches are covered in why moisture content can mislead compared with water activity and caking prevention causes and testing methods.
Dustiness: EN 15051
The EN 15051 series measures how readily a bulk material releases airborne dust under standardized handling conditions. EN 15051-2:2025 uses a rotating drum, while EN 15051-3:2025 uses a continuous-drop method intended to represent operations such as conveying, filling, sacking, loading, and unloading.
For fertilizer bagging, the continuous-drop method can therefore provide a particularly relevant measure of dustiness during falling and filling operations. The result characterizes the material’s tendency to release airborne dust under the specified test conditions.
Dustiness testing answers a different question from granule crushing-strength and abrasion testing. Crushing and abrasion measurements help identify whether the fertilizer is likely to generate additional fines during handling; EN 15051 measures the tendency of the resulting bulk material to release airborne dust.
It does not predict the exact airborne dust concentration at a specific workplace position. Actual exposure also depends on factors such as transfer geometry, production rate, local exhaust ventilation, containment, and work practices.
A comparison with another standardized approach is available in dustiness tests compared: EN 15051 versus EN 17199-4. For the connection between material dustiness and engineering controls, see why dust control in powder handling starts with powder behavior.
From Test Result to Process and Storage Decisions
Segregation testing supports decisions about both blend specification and handling conditions. Results may show that the particle size distribution of one straight material needs tightening, or that differences in particle density or shape remain significant despite closely matched SGN and UI. Plant changes such as reducing drop height or modifying transfer geometry may also limit segregation without changing the formulation.
Hopper discharge requires a separate assessment. Whether a silo operates in mass flow or funnel flow depends on properties such as wall friction and bulk strength rather than segregation data alone. See wall friction and hopper geometry, why one hopper bridges first, and shear cell testing for that part of the evaluation.
Critical relative humidity data supports decisions about storage conditions, packaging, stock rotation, and anti-caking treatment. For ammonium nitrate-containing blends, temperature history may require separate attention because repeated phase changes can weaken granules even when humidity control appears adequate.
Dustiness data from EN 15051 supports decisions about dust-control and containment strategy. Where the question is how effectively equipment contains an airborne release, dedicated containment testing such as powder containment performance testing addresses the equipment side of the problem.
Segregation, caking, and dust generation may occur together, but they should not be treated as one generic flowability failure. Each mechanism needs its own evidence and its own corrective action.