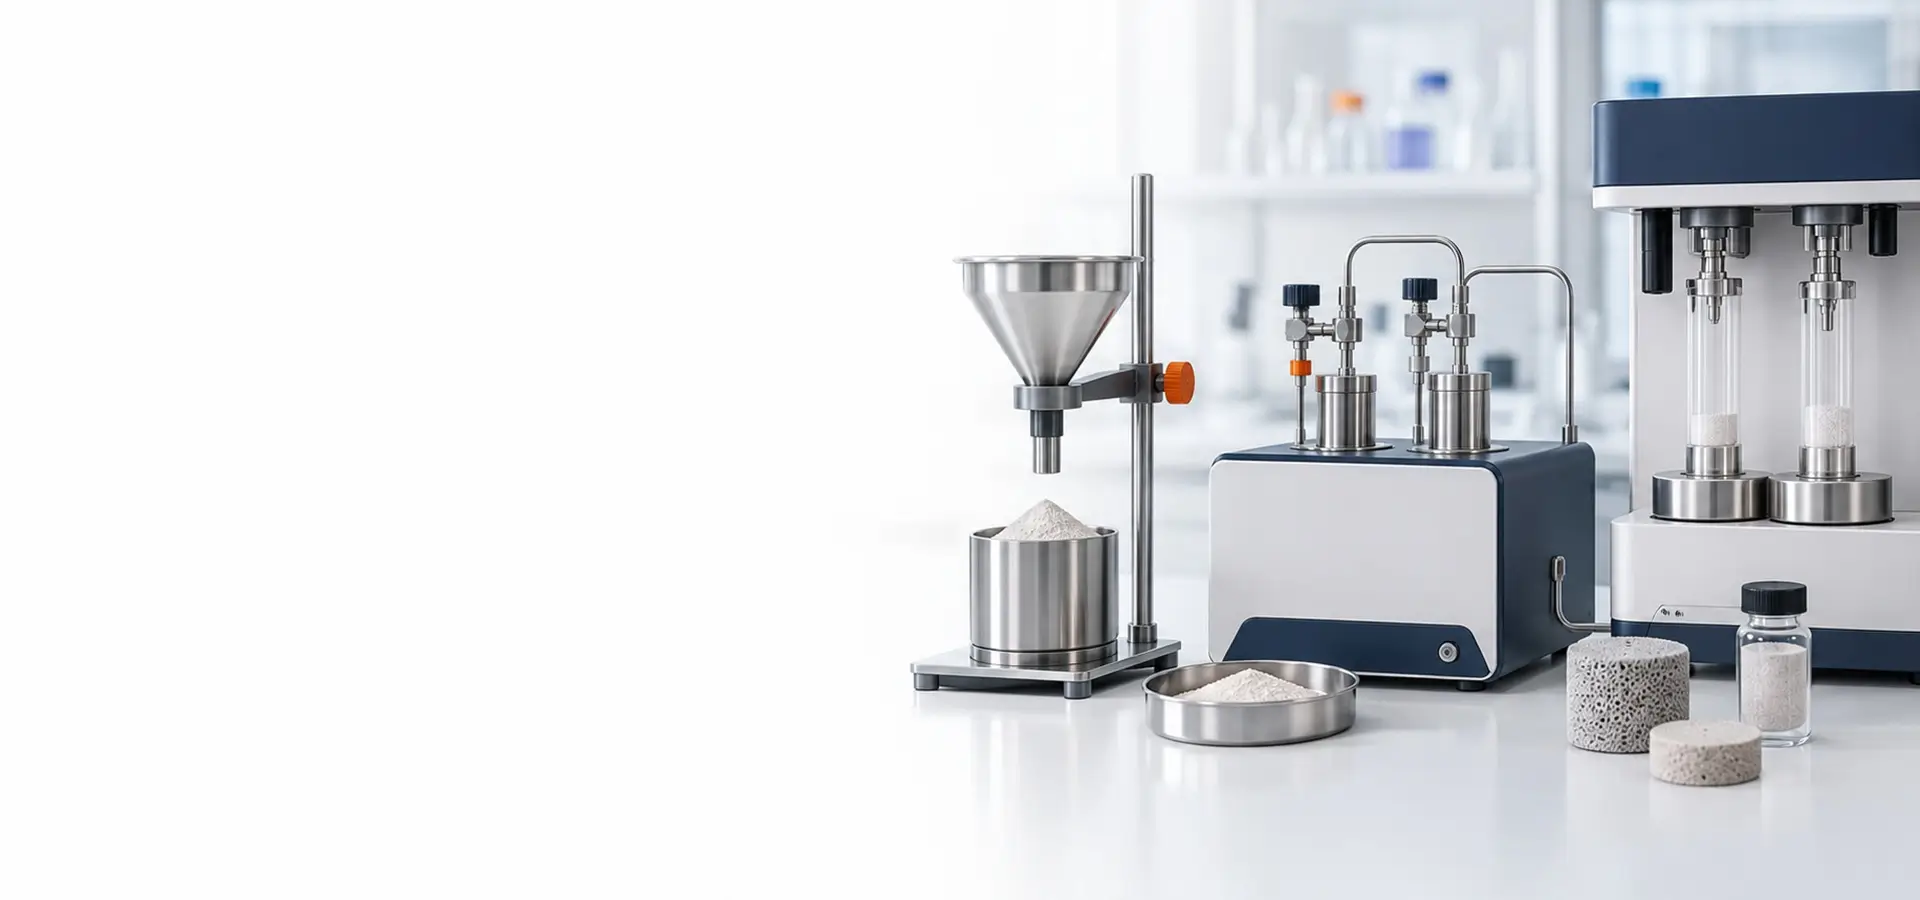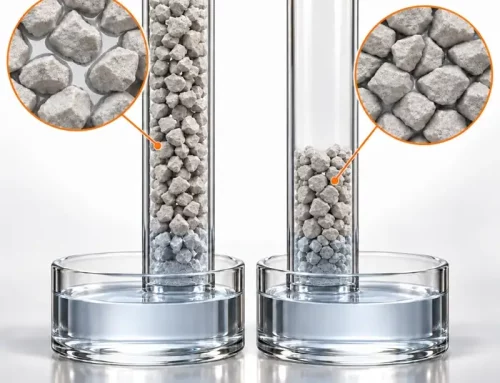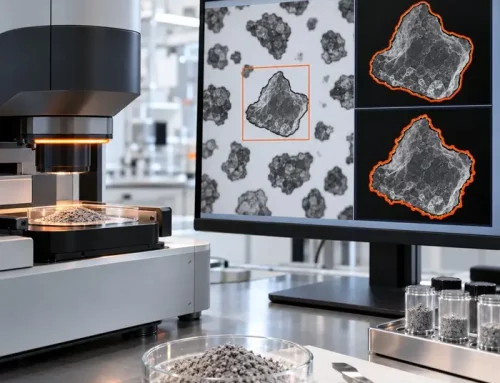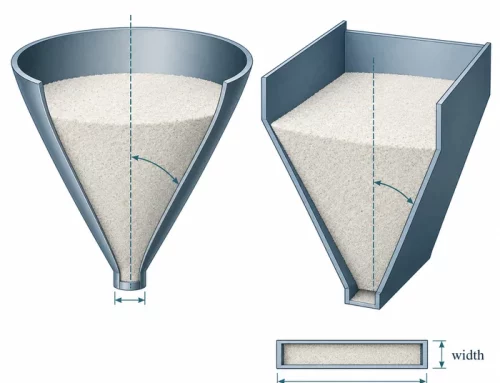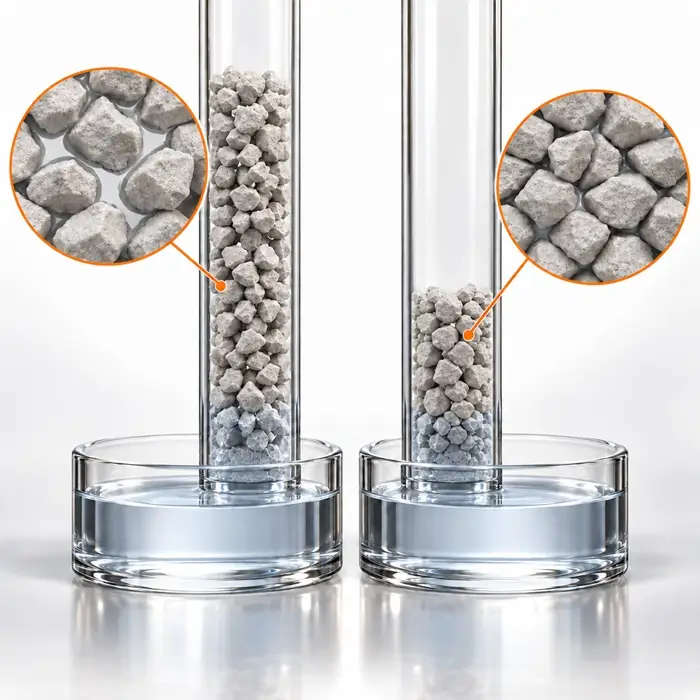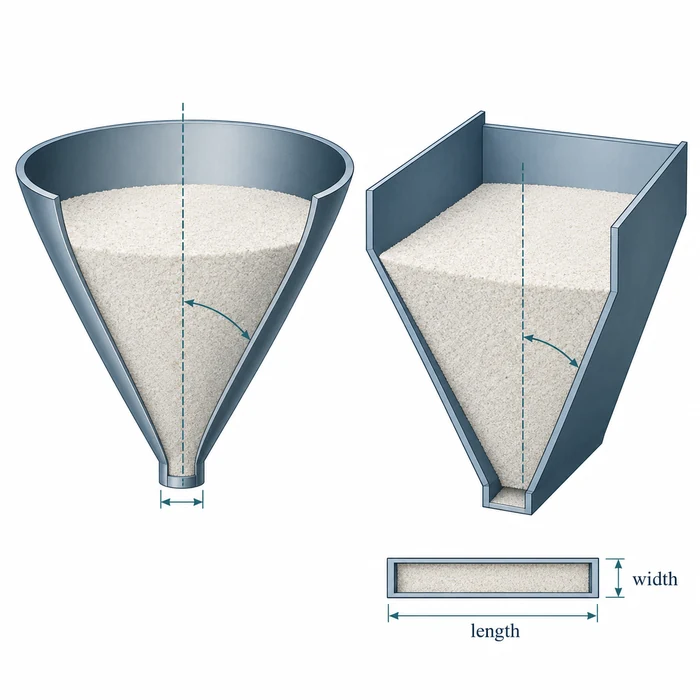
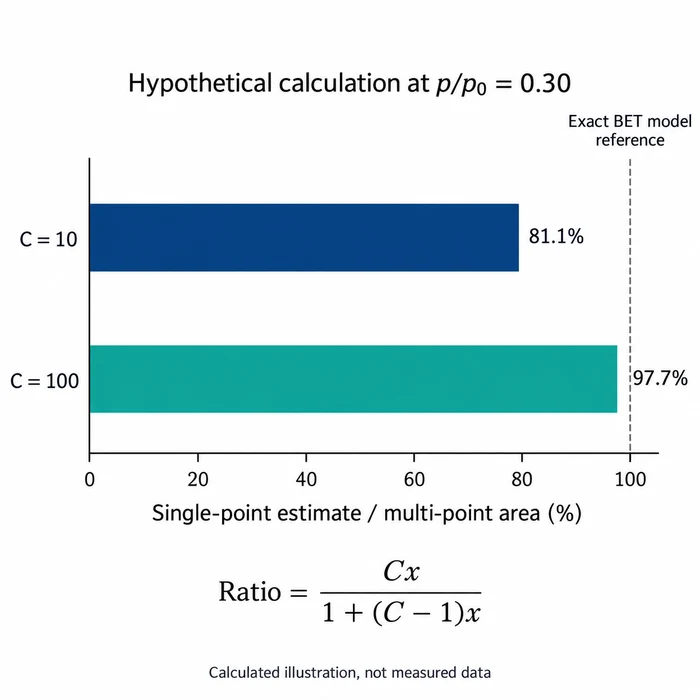
Calculated ideal-model illustration at p/p₀ = 0.30. Percentages compare the uncorrected single-point estimate with each model’s multi-point area; no experimental measurements are shown.
Single-point and multi-point BET calculations on the same recorded isotherm can give different surface areas. With gas, pretreatment, temperature, and mass basis fixed, the calculation itself can produce the gap.
What the Single-Point Shortcut Leaves Out
Let x = p/p₀ and n be the specific amount adsorbed. The linear BET equation gives a plot with intercept a and slope b:
x / [n(1 − x)] = a + b x
The fit gives nₘ = 1/(a+b) and C = 1+b/a. Surface area follows from nₘ and the molecular cross-sectional area σₘ. Rearranging the exact equation gives:
n(1 − x) = nm / [1 + (1 − x)/(C x)] Isolating nm gives an equivalent finite-C correction identity:
nm = n(1 − x) [1 + (1 − x)/(C x)] Applying this correction requires a C value from an applicable multipoint fit of the same isotherm; C is not a fixed property assigned to a material class.
Neglecting (1−x)/(Cx) instead gives the uncorrected single-point estimate nₘ,ₛₚ ≈ n(1−x). Cx much greater than 1 is sufficient; large C alone does not ensure a small error at very low pressure.
nm,sp / nm = C x / [1 + (C − 1) x] The fractional underestimate is (1−x)/[1+(C−1)x]. It is positive for C>0 and 0<x<1, and decreases as either C or x increases with the other fixed.
How Large Can the Difference Be?
Two hypothetical BET isotherms at x = 0.30 show how much the approximation alone can matter:
| Hypothetical C | Single-point area as percentage of multi-point area | Underestimate |
|---|---|---|
| 10 | 81.1% | 18.9% |
| 100 | 97.7% | 2.3% |
For a numerical example, choose nm = 1.00 mmol/g = 1.00 × 10⁻³ mol/g for the C = 10 case. Using IUPAC’s nitrogen cross-section σₘ(N₂) = 0.162 nm² = 0.162 × 10⁻¹⁸ m² and the Avogadro constant L = 6.022×10²³ mol⁻¹:
as(BET) = nm × L × σm
as(BET) = (1.00×10⁻³ mol/g)(6.022×10²³ mol⁻¹)(0.162×10⁻¹⁸ m²) ≈ 97.6 m²/g
The single-point estimate nm,sp ≈ 0.811 mmol/g = 0.811×10⁻³ mol/g gives asp ≈ 79.1 m²/g, a shortfall of 18.5 m²/g (18.9%) relative to the multi-point value of 97.6 m²/g. The chosen capacity is illustrative, not measured.
The pressure 0.30 is illustrative, not a recommended setting. Higher x reduces this model error but may fall outside a suitable BET interval.
C and Fitting-Range Validity Are Different Questions
Low C can reflect an indistinct monolayer-to-multilayer transition. Neither low surface area nor microporosity implies low C: IUPAC associates high C with energetic sites or narrow-micropore filling. An unsuitable fitting interval can also distort C.
IUPAC’s approximate C values of 50 and 80 describe knee sharpness, not single-point acceptance limits; BET is inapplicable below C = 2. A consistent Type I BET calculation still gives an apparent area useful as a fingerprint, rather than a realistic probe-accessible area.
Use the Gap to Investigate the Calculation
- Confirm the single-point formula, selected pressure, units, mass basis, cross-sectional area, and corrections. Corrected single-point procedures fall outside this analysis.
- Inspect the multi-point interval: C must be positive, n(1−x) must increase continuously, and the pressure corresponding to nₘ must lie within the range. A high correlation coefficient alone is insufficient.
- Compare the observed gap with the model prediction for the fitted C and chosen pressure. A mismatch, or a single-point value exceeding the multi-point value, means this approximation alone does not explain the discrepancy.
Reconcile the calculation settings first. If the observed gap then matches the approximation predicted for the fitted C and pressure, the disagreement is explained by the model itself. If a gap remains, or the ordering reverses, that remaining evidence points to the recorded isotherm, degassing conditions and adsorptive gas, or another preparation or model problem rather than to this approximation.