
Table of contents

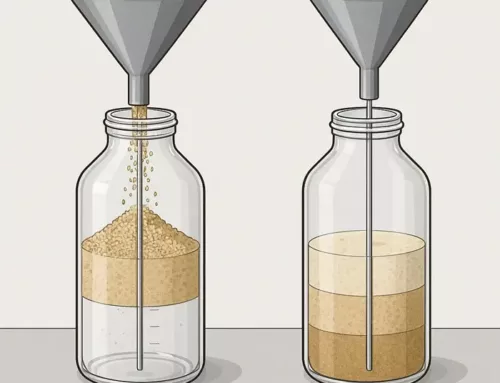
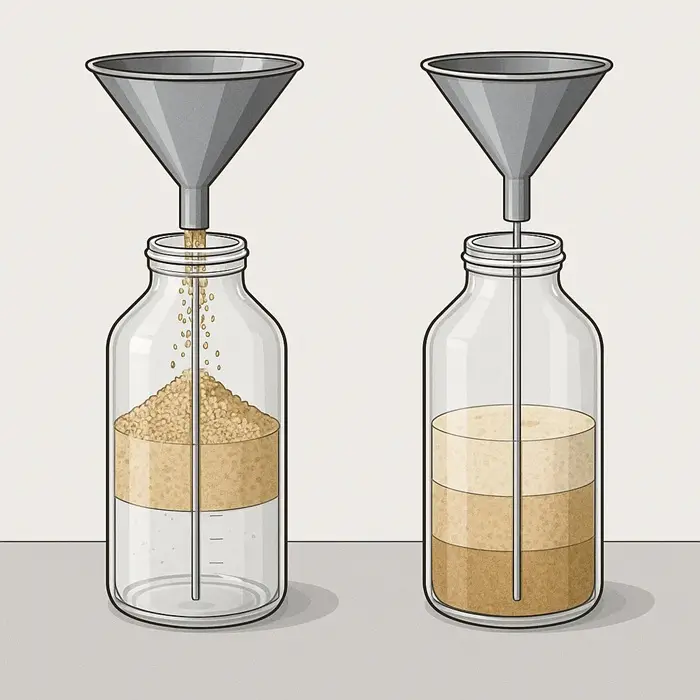
Powder behavior control starts with particle size, it sets the baseline. The median diameter gives a simple view. The full distribution tells the truth. Narrow, monomodal curves boost flow, yet reduce packing. Final compacts then show higher porosity. Broad, polydisperse blends pack densely, yet invite segregation. Fines (<10 µm) punch above their weight. They fill voids, raise contact points, and expand surface area. Cohesion grows and free flow fades. Use laser diffraction to map the distribution. Report cumulative volume and span. A wide span signals higher segregation risk.
Morphology and Surface Architecture
Shape defines how particles interact. Spheres roll and slide with low loss. Flow improves and resistance drops. Irregular plates and dendrites interlock. They build rigid networks and resist motion. Angularity increases friction and stress concentration. Surface roughness raises true contact area. Van der Waals attraction then rises. Surface porosity adds storage for liquids. Pores absorb process aids or moisture. Pressure and temperature changes can release them later. Expect caking or binder shifts when that happens.
Cohesion, Adhesion, and Moisture Effects
Dry particles attract. Van der Waals forces act at every contact. Their strength increases as separation falls. Electrostatic charge adds another pull. Moisture changes the balance again. Thin films form first and shorten gaps. Cohesion rises. Cross a threshold and liquid bridges appear. Capillary forces then dominate. Use the granular Bond number to judge bridge force against particle weight. Control moisture tightly. Set room RH by material class. Add flow aids only after you fix the air.
Electrostatic Phenomena and Control
Triboelectrification builds charge during contact and separation. Work function differences drive transfer. Charged particles stick to walls and form loose agglomerates. Volume resistivity controls dissipation. High-resistivity solids hold charge longer. Relative humidity matters. Thin water layers increase conductivity. At low RH (often <20%), electrostatics can dominate for non-conductive powders. Expect packing issues, fluidization problems, and discharge risk. Use humidity control and antistatic agents where appropriate. Ground equipment and shorten fall heights.
Bulk Density, Flowability, and Shear Testing
Bulk density is state-dependent. Packing history and consolidation define it. Measure aerated and tapped values. The Hausner ratio compares them. Values ~1.00–1.20 indicate good flow. Results >1.40 indicate poor flow and rising cohesion. Flowability is contextual, not a single number. Use a ring shear cell for design data. Map the yield locus at defined consolidation stresses. Report unconfined yield strength, effective angle of internal friction, and wall friction angle against the actual contact material. The flow function coefficient (ffc) is the ratio of consolidation stress to unconfined yield strength.
Segregation Mechanisms and Mitigation
Segregation is a common failure mode. Percolation leads fines downward during vibration or filling. Fluidization pushes lighter, more aeratable fractions upward during discharge. Air currents carry low-density particles off the mainstream. Competing forces decide the outcome. Adhesive forces hold blends together. Gravity and inertia pull them apart. Reduce the drivers first. Match d50 where possible. Tighten span. Align true densities. Increase gentle cohesion with binders only after size work. Control drop heights, belt transfers, and fill rates.
Chemistry, Surface Energy, and Flow Aids
Surface chemistry governs energy, wettability, and charge. Hydrophobic PTFE behaves unlike hydrophilic lactose at the same size and shape. High surface energy materials, such as metals, are more cohesive. Low surface energy polymers often flow more freely. Coatings can shift behavior. Hydrophobic films limit moisture uptake and improve stability. Colloidal silica can act as a spacer. It reduces real contact area and weakens van der Waals attraction. Dose carefully and verify benefits with flow tests.
Environment: Humidity and Temperature Control
Humidity sets water film thickness. Cross the material threshold and bridges form quickly. Caking and flow loss follow. Temperature changes multiple levers. It alters liquid viscosity in bridges. Higher temperatures reduce viscosity and can weaken capillary bonds. Temperature also affects stiffness and charge behavior. Monitor both conditions continuously. Control with HVAC, desiccant dryers, and jacketed vessels. Record setpoints with materials in mind, not by habit.
Design for Handling: Hoppers, Feeders, and Mixers
Mixing aims for a stable blend. Manage segregation risk during and after the cycle. Match sizes and densities and secure enough cohesion for stability. Flow properties drive storage and discharge design. Mass-flow hoppers protect FIFO and limit dead zones. Slope and outlet size depend on your shear data. Use measured effective internal friction and wall friction angles. Select liners and finishes with that data, not guesses.
Compaction and Granulation Behavior
Compaction follows a sequence. Particles rearrange first. Elastic strain adds little bonding. Plastic deformation builds strong contacts. Brittle fracture creates fresh surfaces that bond readily. Moisture acts as a plasticizer at moderate levels. Bonds strengthen as particles deform. Excess moisture causes sticking, picking, or capping on ejection. Control water content tightly. Granulation can tune size, density, and deformation behavior for downstream compression.
Advanced Characterization and DEM Modeling
Dynamic testing replicates process states. Measure flow energy across consolidation levels: test aeration and permeability. Atomic force microscopy probes interparticle forces at the nano-newton scale. It quantifies separation force for a defined contact. Discrete Element Method modeling simulates millions of particles. Each particle has size, shape, and stiffness. The solver tracks forces and motions. Use DEM to predict blender segregation, funnel flow, or caking in storage. Move from descriptive testing to predictive engineering.
Powder behavior control: Putting It Together – Tuning Competing Forces
Powder systems are nonlinear. One change shifts several levers. Milling increases surface area. Dissolution improves, while cohesion rises. Flow may suffer, and moisture uptake can grow. Glidants can restore flow, yet may reduce compact strength slightly. Humidity control lowers electrostatic issues. It can also push RH above a caking threshold. Do not chase elimination. It is not possible. Tune the system to your goal. A free-flowing granule needs low cohesion and balanced size. A compactible blend needs plastic deformation and enough cohesiveness. Use tests to quantify each lever. Then design for the outcome you need.


