🔑 Key Takeaway
DNS-DEM simulations show that charged particles can move upstream against the bulk gas flow when electrostatic forces act in low-drag regions of a square duct. Increasing the delay between injection pulses increased the upstream-moving particle fraction, while pulse duration showed no systematic effect across the tested matrix. The result identifies pulse spacing as the dominant injection variable for this mechanism, within an idealized model using a fixed, deliberately high particle charge.
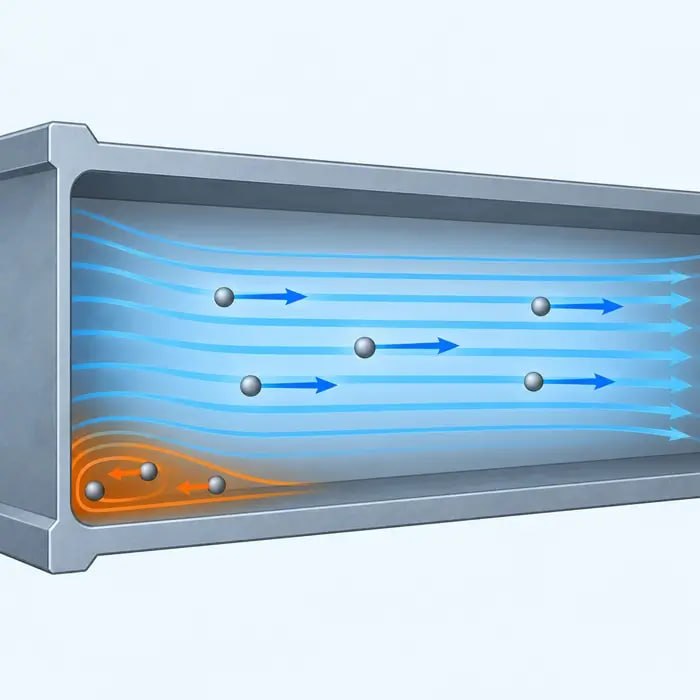
Gas velocity is normally expected to set the dominant particle direction in a pneumatic conveying line. DNS-DEM simulations show that this can fail locally when electrostatic repulsion acts on particles entering regions where aerodynamic drag becomes very low. In those conditions, a fraction of particles can reverse direction and travel upstream against the bulk gas flow.
The finding comes from two studies by Obukohwo and co-workers. The first, published in Powder Technology in 2023, established that discontinuous injection could produce particle back-flow once electrostatic interactions became strong enough. A follow-up study in The Canadian Journal of Chemical Engineering in 2025 examined how the timing of successive particle injections changed that behavior. The papers describe the overall approach as CFD-DEM; the fluid phase itself was resolved using direct numerical simulation, so DNS-DEM is used here for consistency.
The timing study deliberately simplified triboelectric contact charging. Rather than calculating charge generation during conveying, every 15 μm particle was assigned the same fixed charge of 504 fC, a high, idealized value that had already produced back-flow in the earlier simulations. Holding charge constant allowed the effect of injection timing to be examined separately.
The model used a 40 × 40 mm square duct with a friction Reynolds number, Reτ, of 180 and a particle Stokes number of 8. These are controlled DNS-scale conditions rather than a direct representation of a full-scale industrial conveying line, so the study is most useful for identifying the mechanism and the variables that influence it.
How Local Electrostatic Force Can Overtake Drag at the Duct Wall
The striking part of the force balance is how weak the electrostatic effect normally is. In the duct core, streamwise electrostatic acceleration was about four orders of magnitude lower than aerodynamic drag. A charged particle does not simply reverse because electrostatic repulsion is present. Back-flow becomes possible only when the forward drag acting on that particle collapses to a very low level.
That happens preferentially near the corners of a square duct. The turbulent flow develops secondary cross-sectional motion that helps redistribute particles toward the walls and corners, while local gas velocity in those regions is much lower than in the duct core. Once a particle enters a corner zone, its relative motion with the gas can fall far enough for an upstream-directed electrostatic force to become dynamically important.
The simulations placed the reversed particles predominantly in these corner regions. The mechanism is highly localized: electrostatic forces that are negligible compared with drag through most of the duct can control particle motion where aerodynamic resistance becomes exceptionally weak.
Why the Gap Between Pulses Matters More Than the Pulse Itself
The follow-up DNS-DEM study varied two feed variables independently: the duration of each injection pulse and the delay between successive pulses. Injection periods ranged from 1.38 to 16.5 ms, while delays ranged from 2.75 to 176 ms, with single-pulse cases representing an effectively infinite delay.
Across the test matrix, increasing the delay between pulses consistently increased the likelihood of particles moving upstream. At a 2.75 ms delay, the plotted upstream-moving fraction was around 0.1%. At 176 ms, most injection periods produced fractions of several tenths of a percent, while isolated single pulses reached roughly 2% to 5.5%. Pulse duration showed no systematic effect overall, although individual widely separated cases produced larger differences between injection periods.
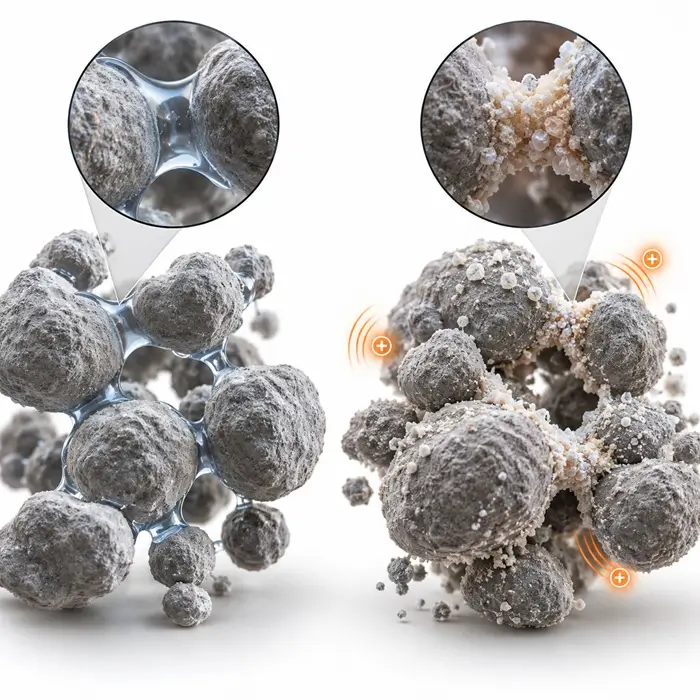
The explanation lies in the electrostatic force balance between neighboring clusters. When clusters are close together, particles experience repulsive forces from charged particles both ahead of and behind them, so those forces partly offset each other. As the delay increases and the following cluster moves farther away, that downstream-directed contribution weakens. Particles near the trailing edge of the leading cluster are then more likely to experience a net upstream-directed electrostatic force.
That force can reverse a particle only after aerodynamic drag has fallen sufficiently. Delay changes the electrostatic force balance; the local flow field determines whether that imbalance is strong enough to produce back-flow.
What This Means for Intermittent vs Continuous Feed Control
Duty-cycled screw feeders, low-fill-fraction rotary valves, and batch or manual charging into a pneumatic conveying line can all create discrete particle pulses rather than a continuous solids stream.
That makes the spacing between injections a practical operating variable. Two feeders can deliver the same average mass flow while producing very different particle-cluster spacing if one feeds nearly continuously and the other delivers doses separated by longer off-times. In the simulations, increasing that separation created more favorable conditions for electrostatic back-flow.
Continuous feeding does not create the same large gaps between successive particle clusters, but it is not a guarantee against electrostatic migration. Particle charge, gas velocity, particle properties, duct geometry, and wall conditions still determine whether local forces can reverse particle motion.
For troubleshooting, compare feeder timing as well as average throughput. If upstream accumulation or dosing instability changes when the off-time between doses changes while the overall feed rate remains similar, intermittent injection becomes a more credible contributor to the problem.
What to Check Before Ruling Back-Flow In or Out
Start with the feeder timing. Record the actual pulse duration, off-time between doses, and average feed rate rather than relying only on the feeder setpoint. Two systems delivering the same average mass flow can create very different particle-cluster spacing.
Then establish whether significant charge is present and whether it persists long enough to matter. Faraday cup sampling can quantify the powder’s charge-to-mass ratio at or near the feed point. A charge decay time test can show whether charge persists over a timescale comparable with the interval between feed pulses. Where suitable sensors are available, inline electrostatic measurements can also reveal charge fluctuations that coincide with feeder duty cycling.
Geometry matters as well. The simulations used a 40 × 40 mm square duct, where secondary flow and very low local gas velocity created favorable conditions for reversal in the corners. Most industrial pneumatic conveying lines are round, so those corner zones should not be transferred directly to every installation. Instead, inspect locations where local velocity or particle-gas slip may fall sharply, including bends, reducers, flange steps, rectangular transitions, and the geometry around the feed entry.
Finally, map where material accumulates and compare that pattern with operating conditions. Upstream deposits that appear or worsen with longer feeder off-times, particularly when measurable electrostatic charge is also present, strengthen the case for back-flow as a contributing mechanism. They do not identify it on their own. Other causes should still be considered, including feeder refill dynamics and the mechanisms covered in electrostatic troubleshooting in powder handling.
References
- Obukohwo, O., Sowinski, A., Mehrani, P., & Grosshans, H. (2023). CFD study of particle backflow in pneumatic conveying systems due to triboelectrification. Powder Technology, 418, 118285. DOI: 10.1016/j.powtec.2023.118285. Journal article | Open-access preprint
- Obukohwo, O., Sowinski, A., Mehrani, P., & Grosshans, H. (2025). The effect of discontinuous injection on particle backflow in pneumatic conveying systems. The Canadian Journal of Chemical Engineering, 103(11), 5680–5689. DOI: 10.1002/cjce.25734. Journal article | Open-access preprint