
Powder property

Particle size distribution

The full distribution matters more than one median value
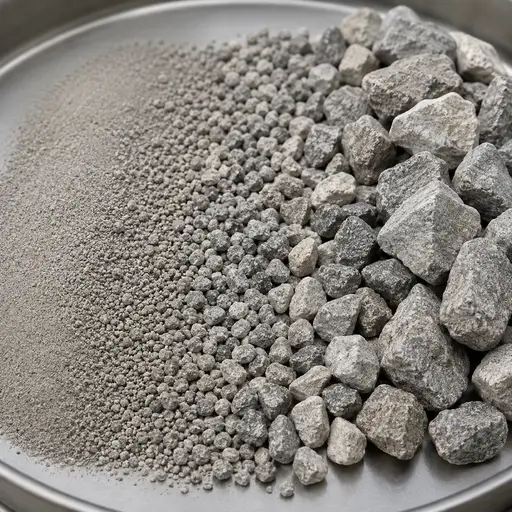
Particle size distribution describes how particle quantity is distributed across size classes under a defined measurement method and reporting basis. D10, D50, D90, fines, oversize, span, and curve shape become useful when they are connected to the process behavior under investigation.


Icon representing the first technical route

Definition

What a reported size distribution represents and why method and basis must remain visible.

Icon representing the second technical route

Governing variables

How tails, width, shape, agglomeration, and sampling influence overall distribution interpretation.

Icon representing the third technical route

Measurement

Which methods distinguish full distributions, retained fractions, and particle dimensions.

Icon representing the fourth technical route

Process relevance

Where PSD shifts become flow, segregation, dust, screening, or dissolution process consequences.

Core concept

Particle size is a distribution, not a single diameter

A powder contains a population of particles rather than one representative size. Percentiles summarize parts of that population, but they do not show the reporting basis, curve shape, shoulders, or whether the sample contained intact agglomerates. Laser diffraction, sieving, and image analysis respond to particles through different physical definitions. Their results can all be valid while producing different numerical distributions. Interpret the full curve together with preparation, dispersion, sampling, and the process question. A stable D50 does not rule out a meaningful change in fines or oversize.

PowderTechnology.info Insight

Report the method, dispersion condition, reporting basis, sampling route, and relevant cutoffs with the result. Define fines and oversize from the operation rather than treating either as a universal size class.

What controls it

Six features shape how particle size distribution is interpreted

The diagnostic value comes from identifying which part of the distribution changed, whether that change is real, and why it matters to the operation.

Fine fraction and D10

D10 locates the lower tail, while the fine fraction measures material below a defined cutoff. Both can affect cohesion, dustiness, permeability, and wetting.

Median size and D50

D50 tracks general movement of the distribution, but powders with the same median can have different tails, width, packing, and process behavior.

Coarse tail and D90

D90 locates the upper tail, while oversize measures material above a defined cutoff. Both can affect screening, dissolution, defects, and blockage risk.

Distribution width and span

A broad distribution can improve packing while increasing segregation risk. The consequence depends on mobility differences and process history.

Curve shape and populations

Shoulders, long tails, or multiple peaks can indicate separate particle populations caused by agglomeration, breakage, recycle, mixed feed, or sample preparation.

Sampling and dispersion state

Segregated sampling or excessive dispersion can create a precise result that does not represent the material state seen by the process.

States and interpretation

The same powder can produce different reported distributions

Match the measurement principle and preparation route to the particle state relevant to the decision.

Measurement state What is represented Interpretation risk Useful control
Dry, gently dispersed Loose particles and weak structures that survive handling Residual agglomerates may appear as coarse material Define pressure and feed conditions
Wet, strongly dispersed Particles and agglomerates remaining after a defined wet-dispersion protocol Fragile process structures may be destroyed Document liquid, chemistry, sonication, and time
Sieved by mass Fractions retained by physical apertures Shape and passage orientation affect retention Control sample mass, time, loading, and sieve condition
Imaged by number Individual projected particle dimensions and shape Rare coarse particles may be poorly represented Report particle count and descriptor definition

How to measure it

Choose a measurement by the size question

Particle size results are method-dependent. Select the principle, preparation, and reporting basis that can resolve the process uncertainty.

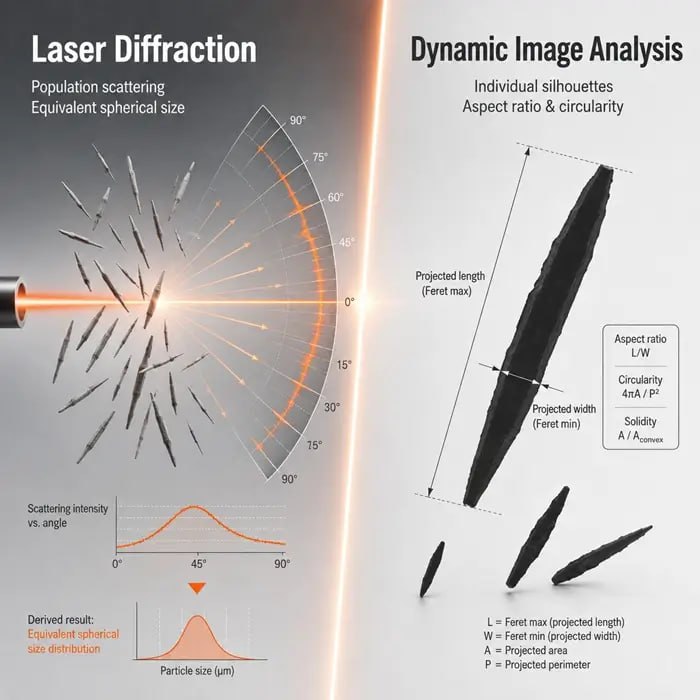
Laser diffraction

Infer a volume-weighted equivalent-sphere distribution from scattering using controlled optical and dispersion conditions.

Sieve analysis

Measure mass retained across defined apertures when oversize, granules, or screen performance matters.

Dynamic image analysis

Measure individual projected dimensions and shape descriptors when irregularity or mixed populations affect interpretation.

Microscopy and morphology

Inspect shape, surface condition, agglomeration, and contamination that a one-dimensional size value cannot resolve.

Sampling and splitting

Verify that the aliquot preserves coarse particles, fines, and blend proportions before instrument repeatability is assessed.

Process-matched comparison

Compare incoming, intermediate, and post-process samples using the same method to locate where the distribution changes.

Where it matters

Particle size distribution becomes a process constraint

Different parts of the distribution control different operations, so the useful specification depends on where the powder must perform.

01

Milling and classification

Target shift, broadening, recycle loading, incomplete breakage, or classifier drift.

02

Storage and discharge

Fine-driven cohesion, permeability loss, segregation, and variable discharge behavior.

03

Conveying and transfer

Attrition-generated fines, coarse-particle damage, and size segregation after transport.

04

Feeding and dosing

Fill-factor drift, screw loading changes, pulsation, and sensitivity to the fine tail.

05

Screening and separation

Blinding, retained oversize, misplaced fractions, and capacity loss.

06

Wetting and dissolution

Floating fines, dry cores, slow coarse-particle dissolution, and residual solids.

Go deeper

Three practical routes into particle size distribution

Explore how distribution tails, measurement basis, and particle shape change the conclusions drawn from particle size data.

Particle size distribution curve showing D10, D50, D90, fines, and oversize

Particle Size Distribution Interpretation: Reading D10, D50, D90, Fines, and Oversize in Process Context

How to connect percentiles, tails, span, and curve shape to a specific process observation.

Read the article

Particle size distribution and material performance

When Laser Diffraction and Dynamic Image Analysis Are Run Together

How laser diffraction and dynamic image analysis complement each other by combining PSD with per-particle shape information.

Read the article

Powder sieving for particle size control

Sieve Blinding: Why Powder Screens Fail Before the Particle Size Spec Does and How to Solve it

How near-size particles, fines, adhesion, and agglomeration can reduce screen performance even when the particle-size specification still appears acceptable.

Read the article

Troubleshoot

Diagnose dust generation and fines release.

Measure

Choose methods for particle size and shape.

Process

Connect PSD with size reduction and classification.

Explore properties

Browse the Particle Behavior & Characteristics hub.

Need the measurement, not just the guidance?

If the remaining uncertainty concerns particle-size distribution, tail fractions, sampling, dispersion, or disagreement between methods, select the measurement around the material state and process decision. PowderTechnology.info can help define the test sequence, sample conditions, and interpretation route. For laboratory support, explore our Delft Solids Solutions partner page or visit Delft Solids Solutions directly.


Delft Solids Solutions logo