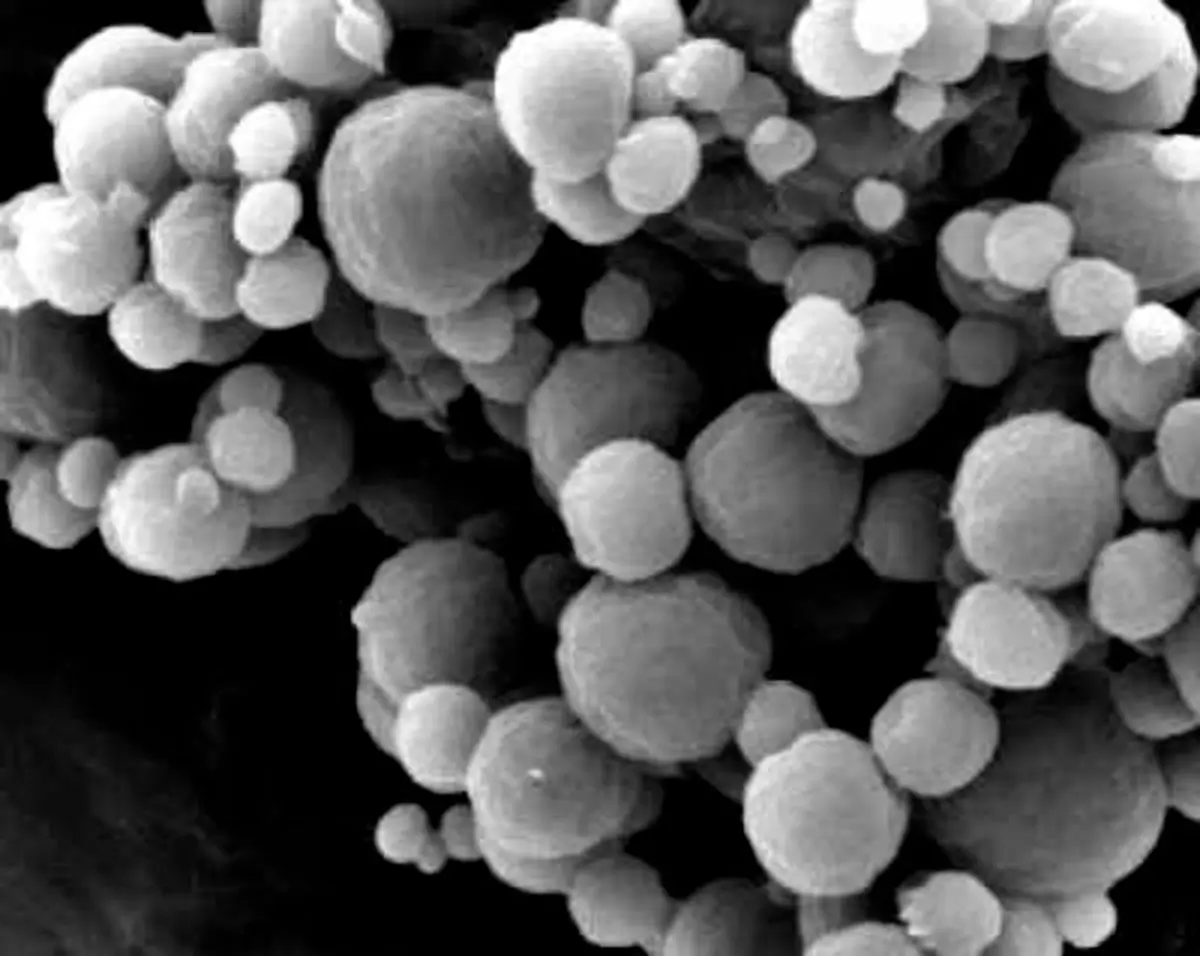
Test methods

Particle size and morphology

Separate size, tails, shape, agglomeration, and morphology before choosing the technique
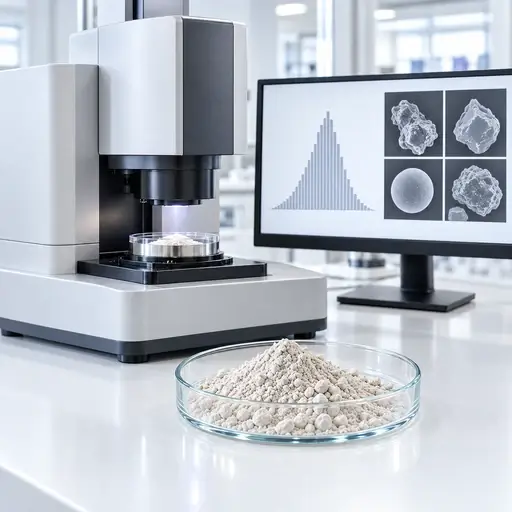
Particle Size and Morphology testing equipment

Particle size, tail fractions, shape, surface texture, agglomeration, and population structure are related, but they are not interchangeable measurements. Select the technique by the physical question, expected size range, material state, required output, and engineering or quality decision.

Test methods

Particle size and morphology

Separate size, tails, shape, agglomeration,
and morphology before choosing the technique

Particle size, tail fractions, shape, surface texture, agglomeration,
and population structure are related, but they are not interchangeable
measurements. Select the technique by the physical question, expected
size range, material state, required output, and engineering or quality decision.


Magnifying glass examining powder particles to identify observed process symptoms

Definition

What this family measures and why one reported diameter cannot describe every particle attribute.

Clipboard checklist representing practical powder field guides

Selection factors

How measurand, range, sample state, dispersion, weighting, and detection limits control the result.

Interconnected powder mechanisms showing relationships between underlying causes

Test methods

Which technique produces the size, tail, shape, morphology, or population evidence the decision needs.

Powder measurement instrument and data display representing relevant measurements

Process relevance

Where size and morphology affect milling, classification, flow, feeding, separation, and liquid-phase performance.

Select a method

Go directly to the measurement route that matches the evidence you need

Each route leads to the measurement principle, sample state, preparation, output, limitation, method disagreement, decision context, and relevant standard.

Core concept

Size depends on method; morphology requires evidence

A particle does not have one universal diameter. Sieving classifies passage through an aperture. Laser diffraction infers an equivalent-sphere distribution from ensemble scattering. Electrical sensing measures displaced electrolyte volume. Sedimentation methods relate motion through a fluid to an equivalent settling diameter. Image analysis measures projected dimensions and shape descriptors from resolved particles.

Morphology adds evidence about angularity, elongation, roundness, convexity, surface texture, fracture, fusion, and agglomeration. Those observations depend on magnification, resolution, orientation, segmentation, field selection, and the number of particles examined.

PowderTechnology.info Insight

Record the sampling route, sample division, dry or liquid preparation, dispersion energy, medium, concentration, instrument configuration, measurement basis, effective range, replicate plan, and treatment of excluded or unresolved material.

Key takeaway

Choose by measurand, population state, and required evidence

Choose particle-size and morphology methods by the physical measurand, population state, and evidence required for the decision. A D50 from aperture passage, light scattering, displaced volume, sedimentation, Brownian motion, or image analysis is not automatically the same quantity; representative sampling, controlled preparation, effective detection range, reporting basis, and method limitations must be defined before results are compared or converted into a process specification.

What controls it

Six decisions define a defensible particle-characterization route

Choose the technique from what must be distinguished, not from the instrument name alone.

Physical measurand

Define whether the decision needs aperture passage, equivalent-sphere size, displaced volume, hydrodynamic size, settling diameter, projected dimensions, or morphology.

Resolution and detection limits

Optics, aperture, pixel size, contrast, thresholds, model assumptions, and background noise determine what is detected or missed.

Sampling and subdivision

Obtain and divide a representative sample without enriching fines, losing oversize, or allowing segregation to redefine the population.

Dispersion and agglomeration

Decide whether clusters belong to the process state or should be dispersed, and confirm that preparation does not fracture fragile particles.

Reporting basis and weighting

Number-, length-, area-, mass-, volume-, and intensity-weighted distributions emphasize different parts of the same population.

Expected range and tails

Confirm that fines, coarse particles, agglomerates, and the central population fall within the effective measurement range.

Selection and interpretation

Different techniques can disagree without either result being wrong

Separate physical measurand, sample state, preparation, range, weighting, and detection limits before comparing two reported distributions.

Measurement question

Primary route

Useful evidence

Interpretation risk

How much material passes a physical aperture?SievingMass retained and cumulative mass passingShape, blinding, loading, attrition, and agglomeration affect passage
What is the ensemble size distribution of a dispersed population?Laser diffractionEquivalent-sphere distribution, D10, D50, D90, span, and tailsOptical model, dispersion state, and volume weighting control interpretation
How many particles occupy each equivalent-volume class?Electrical sensing zoneParticle counts and equivalent-volume size distributionsAperture selection, electrolyte compatibility, concentration, and coincidence matter
How does size influence motion through a fluid?Sedimentation or centrifugal methodsStokes-equivalent diameter and distributionDensity, shape, interactions, fluid properties, and the settling model affect the result
What is the hydrodynamic size of a fine dispersion?Dynamic light scatteringIntensity-weighted hydrodynamic size and dispersity indicatorsA small coarse fraction or aggregate population can dominate scattering
Which particle dimensions, shapes, defects, or populations are present?Image analysis and microscopyDimensions, shape descriptors, population statistics, and direct imagesResolution, orientation, segmentation, field selection, and particle count control the evidence

How to measure it

Select the method by the evidence the decision requires

The method sections below separate principle, sample state, preparation, output, limitation, disagreement, and decision use. Use the image selector above to jump directly to a method.

Test method 01

Sieving

Measurement principle: Physical aperture passage.

Suitable sample state: Dry, free-flowing material with a useful fraction inside the selected sieve range.

Sample preparation: Obtain a representative test portion; control loading, duration, motion, cleaning, and any permitted dispersing aid without breaking particles.

Output and interpretation

Typical outputs: Mass retained by sieve, cumulative mass passing, oversize, and undersize fractions.

Interpretation: The result describes aperture passage. Elongated particles can pass according to orientation, while agglomerates, blinding, electrostatics, or attrition can shift the apparent distribution.

Principal limitation: Aperture range, particle orientation, sieve condition, blinding, cohesion, and applied motion limit what can be resolved.

Decision and boundaries

Why results may disagree: It is mass-based and physically classified, unlike equivalent-sphere optical or projected-image diameters.

Decision supported: Release against a physical cut, screen selection, coarse contamination, or mill/classifier control.

Relevant standard: ISO 2591-1:1988 provides current general test-sieving methods; applicable sieve specifications must also be controlled.

Connect the result to particle-size distribution

Test method 02

Laser diffraction

Measurement principle: Ensemble light-scattering inversion.

Suitable sample state: Dry powder or a stable liquid dispersion within the instrument range and optical model.

Sample preparation: Define dry or wet dispersion, pressure or sonication, concentration, refractive-index inputs, obscuration, background, and the treatment of agglomerates.

Output and interpretation

Typical outputs: Usually a volume-weighted equivalent-sphere distribution with D10, D50, D90, span, and tail fractions.

Interpretation: Check raw signal quality, repeatability, range coverage, optical assumptions, and whether preparation created the population the process decision actually concerns.

Principal limitation: The inversion depends on optical assumptions and a spherical model, while weakly represented coarse particles and fines can be sensitive to sampling and range configuration.

Decision and boundaries

Why results may disagree: It infers diameter from ensemble scattering and therefore will not necessarily match aperture passage, displaced volume, hydrodynamic size, or projected dimensions.

Decision supported: Rapid PSD control, milling endpoints, fines or oversize monitoring, dispersion studies, and comparative lot assessment.

Relevant standard: ISO 13320:2020 covers laser-diffraction particle-size analysis.

Interpret D10, D50, D90, and distribution tails

Test method 03

Electrical sensing zone

Measurement principle: Individual-particle displaced volume.

Suitable sample state: Particles stably dispersed in a compatible conductive electrolyte and sized for the selected aperture.

Sample preparation: Control electrolyte cleanliness, dispersion, concentration, aperture range, flow, coincidence, blockage, and calibration.

Output and interpretation

Typical outputs: Particle counts and number- or volume-based equivalent-volume size distributions.

Interpretation: Confirm that the aperture resolves the required lower and upper tails and that coincidence, debris, bubbles, or blocked apertures have not distorted counts.

Principal limitation: Aperture range, electrolyte compatibility, coincidence, blockage, bubbles, and nonconductive preparation constraints can exclude or distort material.

Decision and boundaries

Why results may disagree: It measures displaced electrolyte volume particle by particle, rather than optical scattering or projected image dimensions.

Decision supported: Number-resolved population control, cell or particle counts, and detection of distinct size populations within an appropriate range.

Relevant standard: ISO 13319-1:2021 covers the aperture/orifice-tube electrical sensing-zone method.

Connect individual-particle counts to the PSD

Test method 04

Gravitational sedimentation

Measurement principle: Settling under gravity.

Suitable sample state: A stable suspension with known fluid properties and a sufficient density difference between particles and liquid.

Sample preparation: Control dispersion, solids concentration, temperature, viscosity, particle density, settling distance, and the assumptions required by the settling model.

Output and interpretation

Typical outputs: Settling-velocity data converted to a Stokes-equivalent diameter distribution.

Interpretation: Non-spherical particles, density variation, convection, hindered settling, Brownian motion, or particle interactions can invalidate a simple Stokes interpretation.

Principal limitation: The conversion requires valid settling assumptions and sufficiently known density and fluid properties; very fine Brownian particles and heterogeneous-density populations are problematic.

Decision and boundaries

Why results may disagree: It reports an equivalent settling diameter and can differ from optical, aperture, volume, and projected-image measurements.

Decision supported: Fine-particle classification, suspension behavior, and size analysis when settling physics is relevant and assumptions are defensible.

Relevant standard: ISO 13317-1:2024 gives current general principles, requirements, and guidance for gravitational liquid sedimentation.

Connect settling evidence to wet-process problems

Test method 05

Centrifugal sedimentation

Measurement principle: Accelerated sedimentation.

Suitable sample state: Fine particles dispersed in a compatible liquid with sufficiently known particle and liquid properties.

Sample preparation: Control density and viscosity inputs, temperature, concentration, dispersion stability, rotor conditions, and the method-specific optical or concentration model.

Output and interpretation

Typical outputs: Method-specific mass- or concentration-weighted distributions expressed as an equivalent sedimentation diameter.

Interpretation: Density assumptions, diffusion, particle interactions, mixtures of different densities, and non-spherical shape can alter the derived size.

Principal limitation: Derived size is model- and density-dependent, and mixed-density or interacting populations can be misinterpreted.

Decision and boundaries

Why results may disagree: Centrifugal acceleration extends sedimentation to smaller particles and shorter times, but the measurand remains motion through a fluid rather than direct geometry.

Decision supported: Resolving fine and nanoscale populations, detecting tails, and comparing formulation or milling changes when density assumptions are acceptable.

Relevant standard: Use the applicable part of the ISO 13318 centrifugal liquid-sedimentation series for the selected instrument principle.

Read the centrifugal sedimentation article

Test method 06

Dynamic light scattering

Measurement principle: Brownian-motion-derived hydrodynamic size.

Suitable sample state: A stable liquid dispersion, commonly containing submicrometer particles, droplets, or fine bubbles.

Sample preparation: Control dispersant, viscosity, temperature, concentration, filtration strategy, equilibration, dust, multiple scattering, and sample history.

Output and interpretation

Typical outputs: Intensity-weighted hydrodynamic size, cumulants mean, polydispersity indicators, and model-derived distributions where justified.

Interpretation: A small population of larger scatterers can dominate the signal. Treat multimodal inversions and converted number distributions cautiously.

Principal limitation: Resolution of mixtures is limited, and a small number of large scatterers or contaminants can dominate the intensity signal.

Decision and boundaries

Why results may disagree: DLS reports hydrodynamic behavior and intensity weighting, not the same diameter or weighting as laser diffraction, microscopy, or electrical sensing.

Decision supported: Rapid checks of fine dispersions, aggregation, formulation stability, and comparative nanoscale behavior.

Relevant standard: ISO 22412:2025 is the current DLS standard.

Compare hydrodynamic size with other size definitions

Test method 07

Static image analysis

Measurement principle: Resolved two-dimensional particle projections.

Suitable sample state: A representative dry deposit, slide, filter, or prepared dispersion in which particles can be individually segmented.

Sample preparation: Control sampling, deposition, overlap, orientation, magnification, illumination, focus, pixel calibration, thresholds, and the number of particles analyzed.

Output and interpretation

Typical outputs: Number-based particle dimensions and shape descriptors such as Feret diameters, aspect ratio, circularity, and convexity.

Interpretation: Inspect segmentation and excluded particles, then report resolution, particle count, field-selection logic, and descriptor definitions.

Principal limitation: Representativeness and the fine-size limit depend on sampling, orientation, overlap, resolution, segmentation, field selection, and particle count.

Decision and boundaries

Why results may disagree: It measures projected geometry directly and usually weights particles by number, so it need not agree with volume-weighted ensemble techniques.

Decision supported: Shape specifications, contamination assessment, fracture evidence, population separation, and morphology-linked process investigations.

Relevant standard: ISO 13322-1:2014 covers static image-analysis methods.

Connect image descriptors to particle morphology

Test method 08

Dynamic image analysis

Measurement principle: High-count images of moving particles.

Suitable sample state: Dry or liquid-dispersed particles transported through a calibrated imaging zone without unacceptable overlap or orientation bias.

Sample preparation: Control feed and dispersion, concentration, motion blur, depth of field, illumination, segmentation, calibration, and acceptance rules.

Output and interpretation

Typical outputs: High-count number-based size and shape distributions, population plots, and images of selected classes.

Interpretation: High throughput improves statistics but does not remove limits from pixel resolution, orientation, segmentation, or unobserved particles.

Principal limitation: Fast population measurement still depends on transport, orientation, depth of field, pixel resolution, concentration, and segmentation quality.

Decision and boundaries

Why results may disagree: It resolves individual projected particles at higher counts than routine microscopy, while laser diffraction remains an ensemble optical inversion.

Decision supported: Routine size-and-shape control, detection of distinct populations, oversize investigation, and comparison of morphology after processing.

Relevant standard: ISO 13322-2:2021 covers dynamic image-analysis methods.

Interpret population-resolved morphology

Test method 09

Optical microscopy

Measurement principle: Direct visual and dimensional evidence.

Suitable sample state: Particles mounted dry, in a liquid, or in a prepared section compatible with the required contrast and resolution.

Sample preparation: Prevent selective sampling and overlap; control mounting, refractive medium, illumination, magnification, focus, calibration, and field selection.

Output and interpretation

Typical outputs: Images, dimensions, qualitative morphology, defects, agglomerate state, and limited or automated population statistics.

Interpretation: The strength is direct inspection. Representativeness depends on field selection and particle count, while small features remain below optical resolution.

Principal limitation: Resolution and depth of field restrict fine features, while manual field selection and low particle counts can bias conclusions.

Decision and boundaries

Why results may disagree: Microscopy can explain why automated size results differ, but a small curated image set is not automatically a representative PSD.

Decision supported: Failure investigation, identification of mixed populations or contamination, and confirmation of shape, damage, or agglomeration.

Relevant standard: When optical images are quantified by static image analysis, ISO 13322-1:2014 is relevant; it does not govern every microscopy investigation.

Connect visual evidence to morphology

Test method 10

SEM and high-resolution microscopy

Measurement principle: Surface and fine-feature morphology.

Suitable sample state: Conductive or coated dry particles mounted to preserve the structure of interest, often under vacuum.

Sample preparation: Control sampling, mounting, coating, beam conditions, magnification, working distance, charging, field selection, and image-analysis rules.

Output and interpretation

Typical outputs: High-resolution images of surface texture, fracture, primary particles, agglomerates, and, when validated, projected dimensions and shape descriptors.

Interpretation: Images can be compelling but unrepresentative. Coating, vacuum, mounting, charging, and operator-selected fields can change or bias the evidence.

Principal limitation: Vacuum, coating, charging, mounting, limited fields, and relatively low particle counts can make images unrepresentative of the bulk population.

Decision and boundaries

Why results may disagree: SEM resolves much finer surface detail than optical imaging, but often examines fewer particles and does not directly provide a bulk, volume-weighted PSD.

Decision supported: Root-cause analysis of attrition, agglomeration, coatings, surface texture, contaminants, and nanoscale morphology.

Relevant standard: Use a validated imaging and measurement procedure. ISO 13322-1 may support static image-analysis logic when its scope is applicable.

Read the PTI SEM article

Test method 11

X-ray micro-CT

Measurement principle: Three-dimensional internal and external structure.

Suitable sample state: Particles, granules, compacts, or representative packed volumes with sufficient X-ray contrast and feature size relative to voxel resolution.

Sample preparation: Control specimen size, immobilization, scan energy, projections, reconstruction, artifact correction, segmentation, voxel calibration, and volume selection.

Output and interpretation

Typical outputs: Three-dimensional size, shape, internal porosity, inclusions, cracks, connectivity, and spatial relationships.

Interpretation: Voxel size is not the same as true resolving power. Contrast, partial-volume effects, artifacts, segmentation, and scanned volume limit detectability and representativeness.

Principal limitation: True spatial resolution is poorer than voxel size alone suggests, and contrast, partial-volume artifacts, segmentation, and scanned volume limit detectability.

Decision and boundaries

Why results may disagree: Micro-CT measures three-dimensional structure non-destructively, while microscopy is usually surface or section based and routine PSD methods reduce particles to equivalent diameters.

Decision supported: Internal-defect analysis, pore and inclusion mapping, granule structure, fracture pathways, and validation of structure-property relationships.

Relevant standard: No single general powder-particle micro-CT standard is forced here; use an application-specific validated method and any sector-specific requirements.

Connect internal structure to porosity

Conditional routes

Use these only when the measurement question requires them

These routes are technically important in the right application, but they are not interchangeable with the eleven primary family methods. Use one when its specific measured quantity, or measurand, matches the engineering or quality decision.

Nanoparticle tracking analysis

Use when number-resolved tracking of individually visible nanoscale scatterers is more informative than an ensemble DLS average.

Aerodynamic particle sizing

Use when motion in air and aerodynamic diameter are the engineering question, particularly for aerosol transport.

Cascade impaction

Use when size-resolved aerodynamic deposition is required for an aerosol or inhalation decision.

Acoustic spectroscopy

Use conditionally for concentrated dispersions where dilution would change the material state and the method assumptions are controlled.

Small-angle X-ray scattering

Use only when nanoscale primary structure, interfaces, or internal structural length scales are the question. It is not a routine replacement for particle-size analysis.

Where it matters

Particle size and morphology become process and product constraints

The same median can conceal different tails, shapes, agglomeration states, and particle histories.

01

Milling and classification

Track the target distribution, coarse survivors, fines generation, and morphology produced by the breakage mechanism.

02

Storage and discharge

Relate fines, shape, agglomeration, and packing changes to segregation, flow, caking, and outlet behavior.

03

Pneumatic conveying

Determine whether impact, abrasion, or agglomerate breakup changes the population delivered downstream.

04

Feeding and dosing

Connect distribution tails and particle form to refill response, packing, delivery stability, and dose variation.

05

Separation and screening

Evaluate cut performance, misplaced material, liberation, recovery, and the physical basis of separation.

06

Wetting, dispersion, and dissolution

Separate effects of fine fraction, surface area, agglomeration, shape, and true primary-particle size.

Technical FAQ

Common questions when methods disagree or overlap

Use these answers to define what should be compared before accepting or rejecting a result.

They measure different physical equivalents and commonly use different weightings. Sieving measures aperture passage and reports retained mass, laser diffraction infers an optical equivalent-sphere distribution, and imaging measures projected dimensions particle by particle. Preparation and detectable range can add further differences.
Choose static imaging when controlled mounting, high magnification, retained images, or detailed inspection matters more than throughput. Choose dynamic imaging when a large particle count and routine size-and-shape population statistics are more important, provided the moving-particle presentation remains representative.
Only when the decision concerns the dispersed or primary-particle state. If agglomerates survive in the process and control flow, deposition, dissolution, or product performance, aggressive dispersion can remove the population that should be measured. Record and justify the applied dispersion energy.
Not as if both reported the same diameter and weighting. DLS is strongly intensity-weighted and derives hydrodynamic size from Brownian motion, while laser diffraction derives an ensemble optical equivalent diameter that is generally presented on a volume basis. Compare them only through a defined material model and overlapping effective range.
They can support a distribution when sampling, resolution, segmentation, field or volume selection, and particle count are validated. Their main strength is structural evidence. A small set of attractive images is not representative population statistics.

Go deeper

Three practical routes into particle characterization

Continue into established sizing principles, milling-related population change, and centrifugal analysis of fine particles.

Featured image for Particle Sizing and Particle Size Analysis

Particle Sizing and Particle Size Analysis

Compare established particle-sizing principles and the evidence they produce.

Read the article

Featured image for Product Development by Milling - Particle size distribution and shape characterization

Product Development by Milling

See how milling changes both size distribution and particle shape during product development.

Read the article

Featured image for Nanoparticles by SEM – electron microscopy analysis

Nanoparticles by SEM – electron microscopy analysis

Examine high-resolution electron microscopy as evidence for nanoparticle size and morphology.

Read the article

Technical basis / sources

Standards and supporting guidance

The standards below support the principal measurement routes on this page. They define method-specific procedures and reporting bases; they do not make unlike particle-size definitions or weighting bases directly interchangeable.

  • ISO 2591-1:1988: general test-sieving methods. Applicable sieve specifications, loading, duration, and handling must also be controlled.
  • ISO 13320:2020: particle-size analysis by laser diffraction, including measurement and reporting considerations for the optical inversion method.
  • ISO 13319-1:2021: electrical sensing-zone particle-size analysis using an aperture or orifice tube.
  • ISO 13317-1:2024: general principles, requirements, and guidance for gravitational liquid sedimentation. For centrifugal sedimentation, use the applicable part of the ISO 13318 series for the selected instrument principle.
  • ISO 22412:2025: particle-size analysis by dynamic light scattering.
  • ISO 13322-1:2014: particle-size analysis by static image analysis.
  • ISO 13322-2:2021: particle-size analysis by dynamic image analysis.

For optical microscopy, SEM, and X-ray micro-CT, use a validated application-specific imaging and measurement procedure. State the sampling basis, calibration, spatial resolution, segmentation rules, orientation effects, and dimensional definition used. ISO 13322-1 may support quantified static image analysis where its scope applies, but no single general powder-particle standard is asserted here for every microscopy or micro-CT application.

Need the measurement, not just the guidance?

If the remaining uncertainty concerns particle-size distribution, tail fractions, sampling, dispersion, particle shape, morphology, surface texture, or disagreement between methods, select the measurement around the material state and process decision. PowderTechnology.info can help define the test sequence, sample conditions, and interpretation route before work is placed with a specialist laboratory. PTI works closely with Delft Solids Solutions, a contract research organization specializing in the physical behavior of powders and granules. Contact Delft Solids Solutions.


Delft Solids Solutions logo