Table of contents
Dustiness testing quantifies airborne release during handling. Results inform exposure models, SDS inputs, and control design. Method choice depends on the metric you need, the handling scenario, and any nanoform duties.
EN 15051: mass based dustiness
EN 15051 measures dustiness as collected mass in defined size fractions. You select a rig that simulates the process step. You then report dustiness indices by fraction under set conditions.
Rotating drum (EN 15051-2): purpose, outputs, parameters
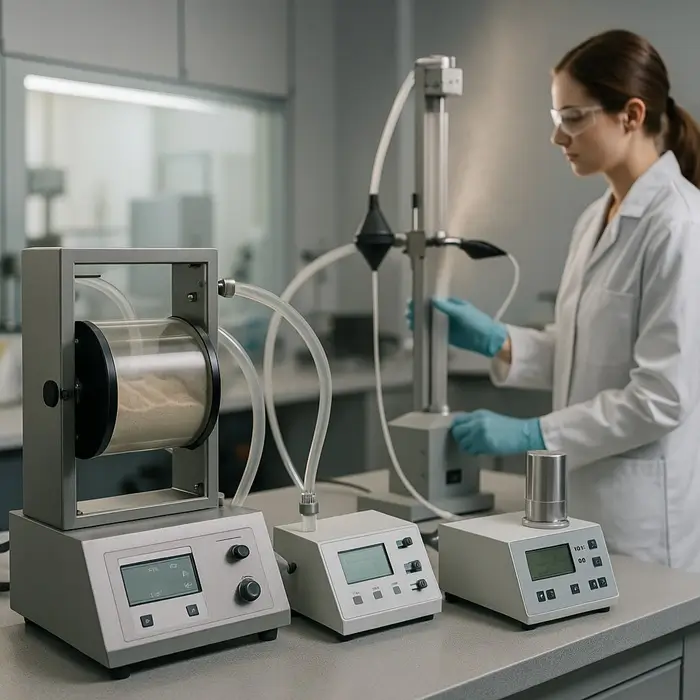
The drum lifts and drops a conditioned sample at controlled airflow. It represents repeated handling, like tumbling or agitation. You collect inhalable, thoracic, and respirable mass. Typical outputs include dustiness indices per fraction and descriptive stats. Record drum speed, air flow, sample mass, and duration.
Continuous drop (EN 15051-3): purpose, outputs, parameters
The drop rig drives the sample through a vertical counterflow. It represents falling transfers and discharges. You collect inhalable and respirable mass. Report the drop height, air flow, feed rate, and exposure time. Use this rig when free fall dominates emissions.
Data reduction and indices
Compute dustiness indices as collected mass normalized to sample mass. Present mean, standard deviation, and coefficient of variation. Include blanks and background corrections. Use classification bands only when your client needs them.
EN 17199-4: nano release with mass and number metrics
EN 17199-4 targets powders that contain or release nano objects. The small rotating drum couples a cyclone and filter with real time counters. The method reports both respirable mass and number based indices.
Required outputs and instrumentation
Report the respirable mass fraction using a cyclone and filter. Report total number concentration with a CPC. Report size resolved number with an ELPI or an equivalent classifier. Time resolved traces reveal short peaks that mass alone can hide. The small drum needs little sample and supports simultaneous sampling.
Data treatment and artefacts
Zero and leak check the system. Subtract background counts from CPC and ELPI streams. Watch for particle bounce and charge effects in impactors. Confirm cyclone cut point with the specified flow. Document any agglomerate breakup visible in the size spectra. Flag transport losses if tubing runs are long.
Method selection framework
Select the standard by aligning the decision with your question. Then match the rig to the handling mode.
Decision guide
If you need mass for exposure models, use EN 15051. If you need nano release and sizes, use EN 17199-4. For repeated handling, choose the rotating drum. For falling transfers, choose the continuous drop. Add EN 17199-4 when nanoform duties exist, even if you already run EN 15051.
Worked examples
A blender discharge shows nuisance dust at the chute. Use continuous drop to mirror the fall and select capture flow. A drum tumbler step drives visible haze during repacking. Use a rotating drum to quantify repeated agitation. A metal powder for AM raises nano concerns during sieving. Use EN 17199-4 to quantify number of peaks and sizes.
Sample preparation and conditioning
Representative sampling protects data quality. Conditioning reduces uncontrolled variance.
Representativeness and packing
Draw increments across the lot. Use riffle or rotary splitting. Avoid segregation during transfer. Pack the test subsample as the method prescribes. Do not over-compact cohesive powders.
Moisture control and time to test
Record moisture and water activity where relevant. Seal samples after conditioning. Test within a defined window to limit drift. Note visible caking or attrition before loading.
QA and repeatability
A defensible report shows control of error sources. It also shows stability across replicates.
Replicates, blanks, control materials
Run at least triplicate tests for each condition. Include system blanks for mass and number streams. Use a lab control material to track day to day variance. Apply acceptance limits for repeatability before releasing results.
Calibration and checks for CPC and ELPI
Verify CPC flow and coincidence limits. Confirm ELPI class boundaries and electrometer health. Record aerosol line losses if you change tubing. Reference EN 16897 for CPC number concentration and ISO 27891 for CPC calibration in the appendix. Document all calibrations in the report appendix.
Reporting template
Clear reports help engineers act. They also support audits and cross-lab comparisons.
Must report fields
State the standard, rig, and revision. List sample ID, conditioning, mass, and environmental conditions. Provide airflow, drum speed or drop settings, durations, and sampler types. Report dustiness indices with units and uncertainty. For EN 17199-4, include CPC ranges, ELPI class edges, time resolved traces, the time to 50 percent of total released particle number (T50), and the number-based emission rate. Present detection limits and any method deviations. No number-based classification scheme is established yet in EN 17199-4; report raw indices with uncertainty.
Common pitfalls and how to avoid them
Avoid incomplete conditioning notes. Avoid missing blanks for number streams. Do not merge mass and number metrics into a single index. Keep rig choice aligned with the handling step. Always separate method deviations in a clear section.
Linking results to controls
Use your data to target the highest yield fixes. Then verify the effect with the same method.
Transfer points and free fall
If continuous drop mass is high, enclose the drop. Reduce fall height. Add local capture and smooth inlets. Re test at the same settings to confirm gains.
Repeated handling and agitation
If drum dustiness is high, lower agitation energy. Improve seals and automate refills. Re test after each change and trend the indices.
Nano release controls
If CPC or ELPI peaks are high, add HEPA capture near the source. Shorten tubing and remove bends. Validate with a second EN 17199-4 run. Confirm background stability before and after.
Conclusion
Choose the standard that fits the decision. Match the rig to the handling step. Document conditioning, flows, and settings. Report mass and number metrics with uncertainty. Link each result to a specific control. Repeat the same test after changes and show the reduction. That delivers defensible data and proven improvement.

