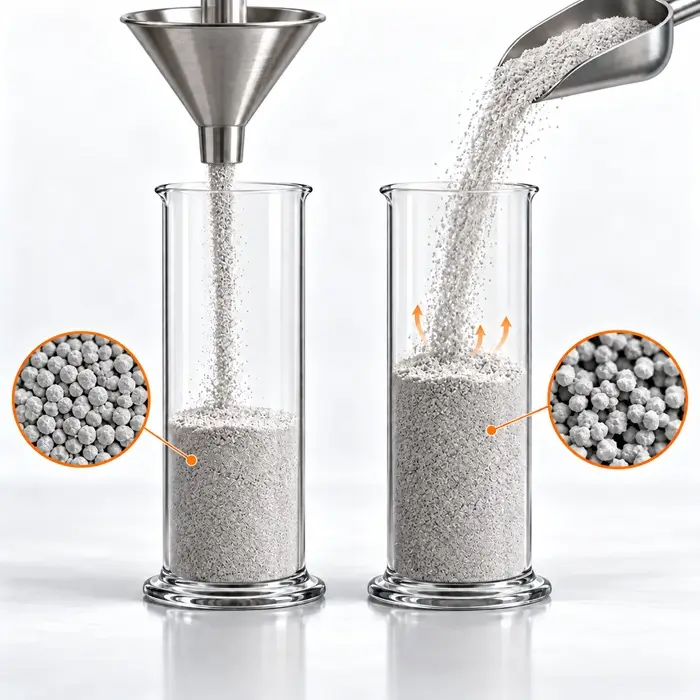
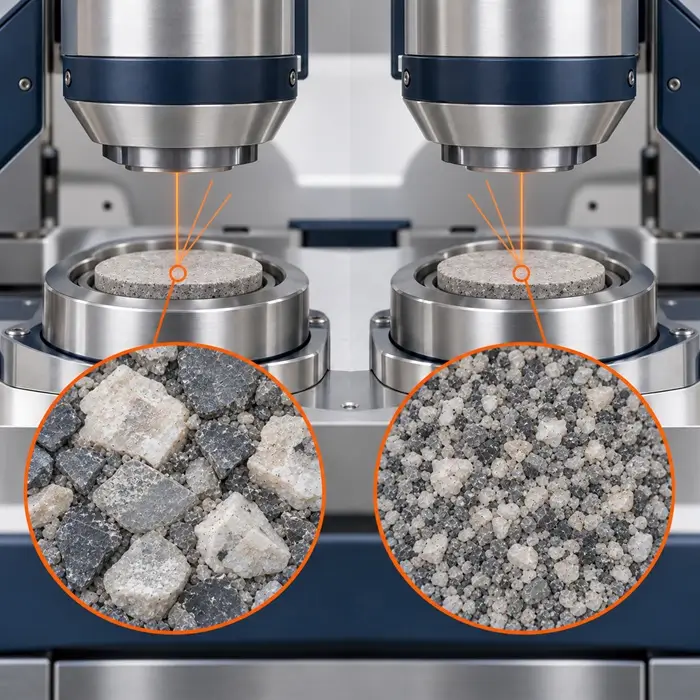
Two portions of the same powder produce different XRF results after one is ground more finely. Is the process changing, or is the laboratory measuring a preparation effect?
Why Particle Size Affects XRF
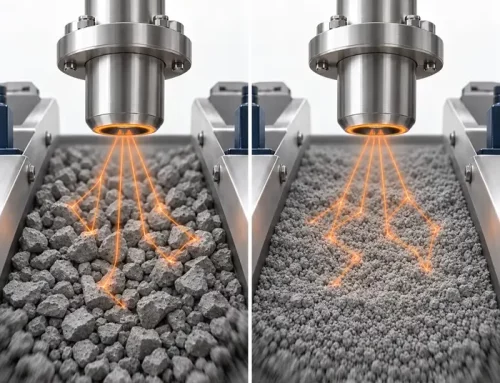
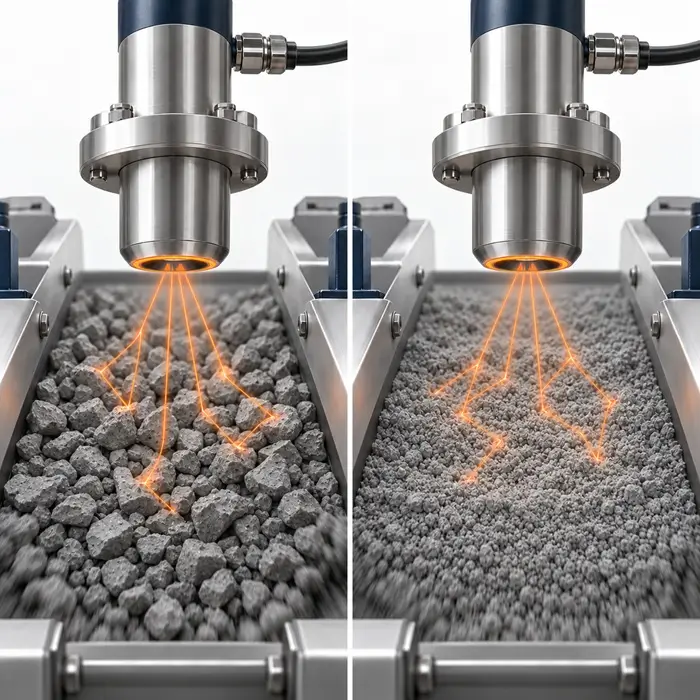
X-ray fluorescence (XRF) measures characteristic X-rays emitted by an excited specimen. Some radiation is absorbed before reaching the detector, and the information depth differs by analytical line. For a NIST 1412 silicate glass matrix, an ENFSI guideline estimates information depths of roughly 10 µm for Si Kα and 100 µm for Fe Kα. Lower-energy lines, such as Na Kα, probe shallower layers; heavier-element lines generally sample deeper material. Depth also depends on matrix composition, density, and measurement geometry. When grains approach or exceed the relevant depth, local mineral grains and surface geometry can dominate the signal. Grinding reduces grain-size and presentation effects, but cannot fully remove differences in X-ray absorption among mineral phases at practical grind sizes.
What the Research Shows
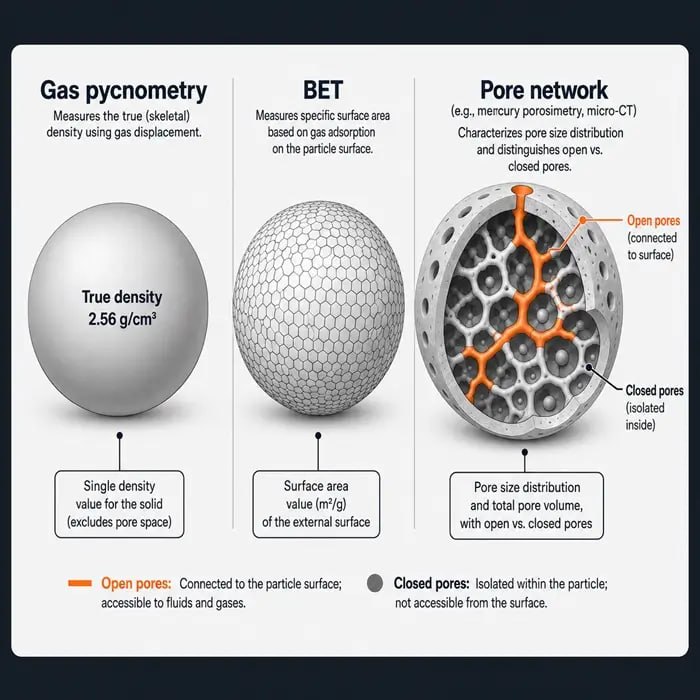
Mzyk, Baranowska, and Mzyk (2002) studied pressed pellets of copper ores, concentrates, and slag. They used an extremely fine internal-standard powder whose fluorescence intensity tracked the particle size of the surrounding sample, allowing corrections to multiple analyte intensities. Goff et al. (2020) compared portable XRF readings on field-moist soil cores, dried and ground loose powders, and pressed pellets against benchtop XRF. Pressed pellets generally agreed more closely, but SiO₂ remained problematic. The authors also identified density as a possible factor: pellets averaged 2.56 g/cm³, versus 1.69 g/cm³ for cores.
Four Checks Before Reporting a Composition Change
1. Separate Measurement From Preparation Repeatability
Measure one specimen repeatedly, then compare independently prepared pellets from representative splits. Agreement on one pellet does not establish preparation repeatability. If the shift is largest for low-energy lines and decreases at higher energies, investigate specimen-dependent absorption and presentation. Confirm the cause with the controlled comparison in Check 3 rather than assuming a genuine composition change.
2. Examine the Powder and Pellet
Check the full particle size distribution, mineral heterogeneity, pressing pressure, binder ratio, pellet thickness, and surface condition. Verify sample splitting and cleaning between batches. Grinding media can contaminate results. Hickson and Juras (1986) found that tungsten carbide introduced Co, Nb, and W, while chrome steel introduced Fe, Cr, and Mn. Agate produced no measurable contamination in their study, although wear of silica-based agate remains a potential Si source.
3. Prepare a Controlled Comparison Set
Start with representative portions of one well-mixed bulk sample, ground for three or four durations. Prepare the pellets identically and plot XRF intensity against grinding time for the lightest critical analyte. Following Turner, use the plateau to select a grinding endpoint, then check repeatability with independently prepared pellets and accuracy against a suitable certified reference material. Grinding beyond that point can introduce contamination or agglomeration without improving accuracy.
4. Decide Between Pressed Pellets and Fusion
Once intensity reaches a plateau, retain pressed pellets if matrix-matched calibration meets the required uncertainty. If mineralogical effects persist, borate fusion can produce a more homogeneous glass and reduce particle-size and mineralogical bias for compatible materials (Nakayama and Wagatsuma, 2017). Its trade-offs are higher trace-element detection limits from flux dilution and possible loss of volatile constituents. If the apparent composition shift disappears with controlled preparation, it was a preparation artifact; leave production settings unchanged.
Frequently Asked Questions
Technical Basis / Sources
– Mzyk, Z., Baranowska, I., and Mzyk, J. (2002). Research on grain size effect in XRF analysis of pelletized samples. X-Ray Spectrometry, 31(1), 39–46. – Goff, K., et al. (2020). Impact of sample preparation methods for characterizing the geochemistry of soils and sediments by portable X-ray fluorescence. Soil Science Society of America Journal, 84(1), 131–143. – European Network of Forensic Science Institutes (2022). Guideline for the Micro X-ray Fluorescence Spectroscopy of Glass Samples in Forensic Science. Section 5.2, information depth. – Nakayama, K., and Wagatsuma, K. (2017). Glass Bead Sample Preparation for XRF. Encyclopedia of Analytical Chemistry. – Hickson, C. J., and Juras, S. J. (1986). Sample contamination by grinding. The Canadian Mineralogist, 24(3), 585–589. – Turner, K. XRF Laboratory Tips: Sample Preparation. Australian X-ray Analytical Association.