- Key takeaway
- Why Powders Make Subsampling Difficult
- Define the Decision Before Dividing the Powder
- Check Whether the Comparison Can Answer the Question
- Build Independent Preparation Paths
- Run and Document the Study
- Worked Example: Which Stage Controls the Result?
- Estimate Variability and Compare the Mean
- Decide What to Change or Repeat
- Technical Basis / Sources
- Related Reading
- About the Author: AGENT PTI
- Related Posts
A powder blend is tested for a trace contaminant against a 25 mg/kg specification limit. One test portion gives 18 mg/kg. Another, taken from the same laboratory sample, gives 29 mg/kg. Repeating the measurement of the second extract produces 29 mg/kg again. The analytical reading is repeatable, but the disagreement between portions remains unexplained. It could originate during powder division, test-portion selection, or preparation. Before either result can support a reliable specification decision, the laboratory must establish how much variation the procedure introduces. Even if both portions had produced the same result, they could still share a bias.
Why Powders Make Subsampling Difficult
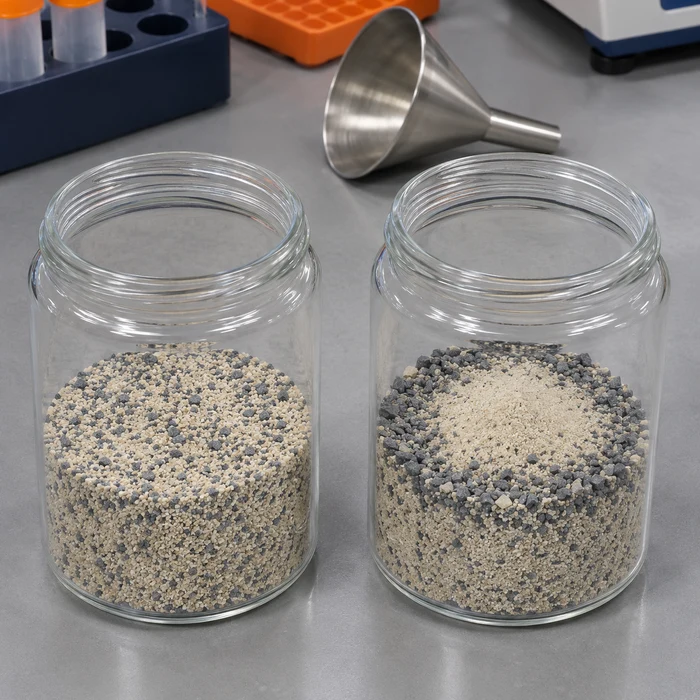
A homogeneous, well-mixed liquid can yield test portions with nearly identical constituent concentrations, provided the constituent remains uniformly distributed. Powders are different because the material consists of discrete particles that may vary in composition, size, density, and shape.
A low-level constituent might occur in a small population of contaminant particles, in agglomerates containing an active ingredient, or in fragments of wear debris. Even when those particles are randomly distributed, different test portions can contain different numbers of them. This introduces variation before extraction or analytical measurement begins.
Fundamental sampling error
Pierre Gy’s Theory of Sampling describes the fundamental sampling error arising from differences in particle composition. Even an ideal, correctly executed sampling operation cannot eliminate this contribution entirely [4, 6].
Under simplified conditions, when the source mass greatly exceeds the test-portion mass, the relative variance of fundamental sampling error scales approximately with:
Relative variance ∝ d³ / M
Here, d represents a characteristic particle size used in the sampling model, and M is the selected sample mass. The relationship also depends on particle composition, density, shape, size distribution, and other material-specific factors.
Consequently, large constituent-bearing particles can increase subsampling variability substantially. Increasing the test-portion mass or appropriately reducing particle size can reduce fundamental sampling error. Mixing alone cannot eliminate it. Particle-size reduction, where used, must not alter the measurand or compromise the analytical procedure.
Segregation and incorrect division
Fundamental sampling error is not the only source of variation. Particles can segregate during filling, handling, vibration, or discharge. Size and density differences may cause the constituent-bearing population to concentrate in particular regions of the powder, so successive fractions entering a splitter differ in composition.
The splitting operation introduces further risks. A riffle splitter requires appropriate chute dimensions and reasonably uniform feeding across its width. Feeding predominantly from one side, bridging in individual chutes, or selective powder retention can compromise division.
A rotary divider distributes material through repeated collection events. Nevertheless, feed rate, equipment geometry, material behavior, and losses still matter. Neither splitter type guarantees representative fractions under every operating condition.
These mechanisms are discussed in PTI’s powder segregation guide.
The purpose of qualification is to determine whether the complete splitting and preparation sequence performs adequately for the intended material and measurement. Identifying the dominant error mechanism may require additional controlled comparisons.
Define the Decision Before Dividing the Powder
Begin with the result the laboratory must report. Specify the constituent, its chemical or operational definition, the concentration basis and units, and the material to which the result applies. Establish the intended concentration range, including any specification or decision limit.
Then define the complete procedure under evaluation. Record the starting laboratory-sample mass, material condition, mixing and transfer steps, splitter type, feeding method, retained fraction, subsequent reductions, and final analytical test-portion mass.
Extraction or digestion and analytical measurement must also be specified. These stages affect the observed result and cannot be excluded merely because the study focuses on powder splitting.
Set acceptance criteria before generating qualification data. The criteria should address the variability expected from a routine result, the acceptable difference from a suitable reference, and the uncertainty or decision rule used to judge both.
A specification limit alone does not establish the allowable measurement variability. The laboratory must consider the intended decision, applicable method requirements, consequences of incorrect classification, and required confidence. There is no universal acceptable percentage for every powder or constituent.
The starting laboratory sample also defines the scope of the study. Independent preparations made after that point can assess variation introduced downstream, but they cannot establish whether the original sample represented the production lot.
For that wider issue, see PTI’s representative powder sampling guide. Eurachem provides separate guidance on sampling-related uncertainty and validation of measurement procedures involving sampling [2, 3].
Check Whether the Comparison Can Answer the Question
Before consuming material in a qualification study, establish whether the analytical method can resolve the differences that matter.
Review its validated range, detection and quantitation capabilities, blank behavior, recovery information, and performance at the intended test-portion mass.
At low concentrations, this is critical. If many test portions produce results below the quantitation or reporting limit, the available measurements may not support a reliable estimate of mean concentration or variability.
Do not automatically replace censored results with zero or half the reporting limit. Choose a statistically defensible treatment before the study, considering the expected number of censored observations and the information retained by the analytical method. If the method cannot support the planned comparison, improve its measurement capability or redesign the study.
Select a suitable reference
Mean agreement requires an appropriate comparison value for the same measurand.
A certified reference material can provide evidence when its matrix, concentration range, stability, assigned uncertainty, and minimum test-portion mass suit the intended procedure.
Where no suitable certified material exists, an independently characterized material or justified reference method may be appropriate. The comparison must document how the reference value was established and which uncertainties or biases remain.
A spike can test recovery of added constituent, but its behavior may differ from constituent already distributed within the powder. Likewise, agreement between methods sharing extraction or calibration steps may conceal a common bias. A reference material that cannot be tested at the routine portion mass does not directly establish performance at that mass [1].
Build Independent Preparation Paths
A qualification study must reproduce the stages whose variability it intends to estimate.
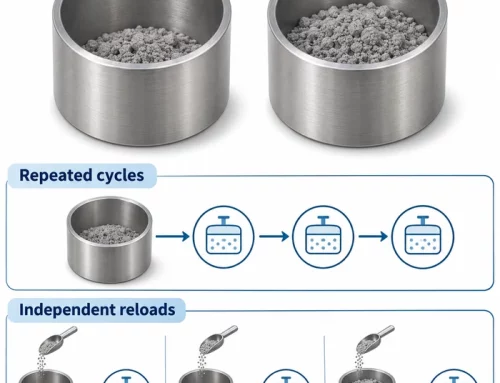
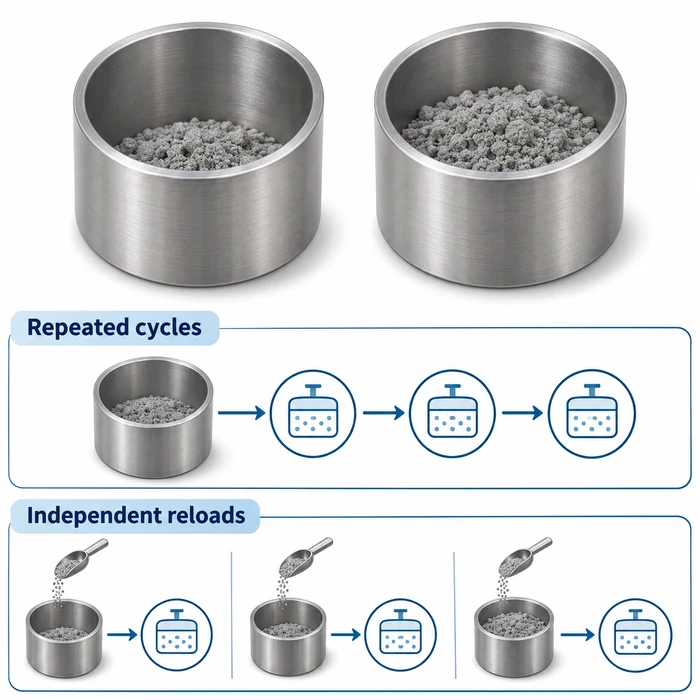
One practical design uses independently replicated preparation paths, with multiple separate test portions within each path. Each portion is weighed and prepared independently. Additional readings of the same extract can then estimate short-term analytical repeatability.
A second instrument reading of one extract does not repeat powder division. A second independently extracted portion includes portion selection and preparation. A separately replicated splitting sequence adds variation associated with the independently repeated operations.
However, several fractions collected from a single initial split share that operation. They cannot be treated as independent replicates of it.
To evaluate variation among complete splitting runs, repeat the splitting sequence using appropriately allocated starting material and document how those starting inputs were obtained. Differences among starting inputs may contribute to the estimated path variance. The design must account for this shared history.
Figure 1. Nested preparation and measurement design
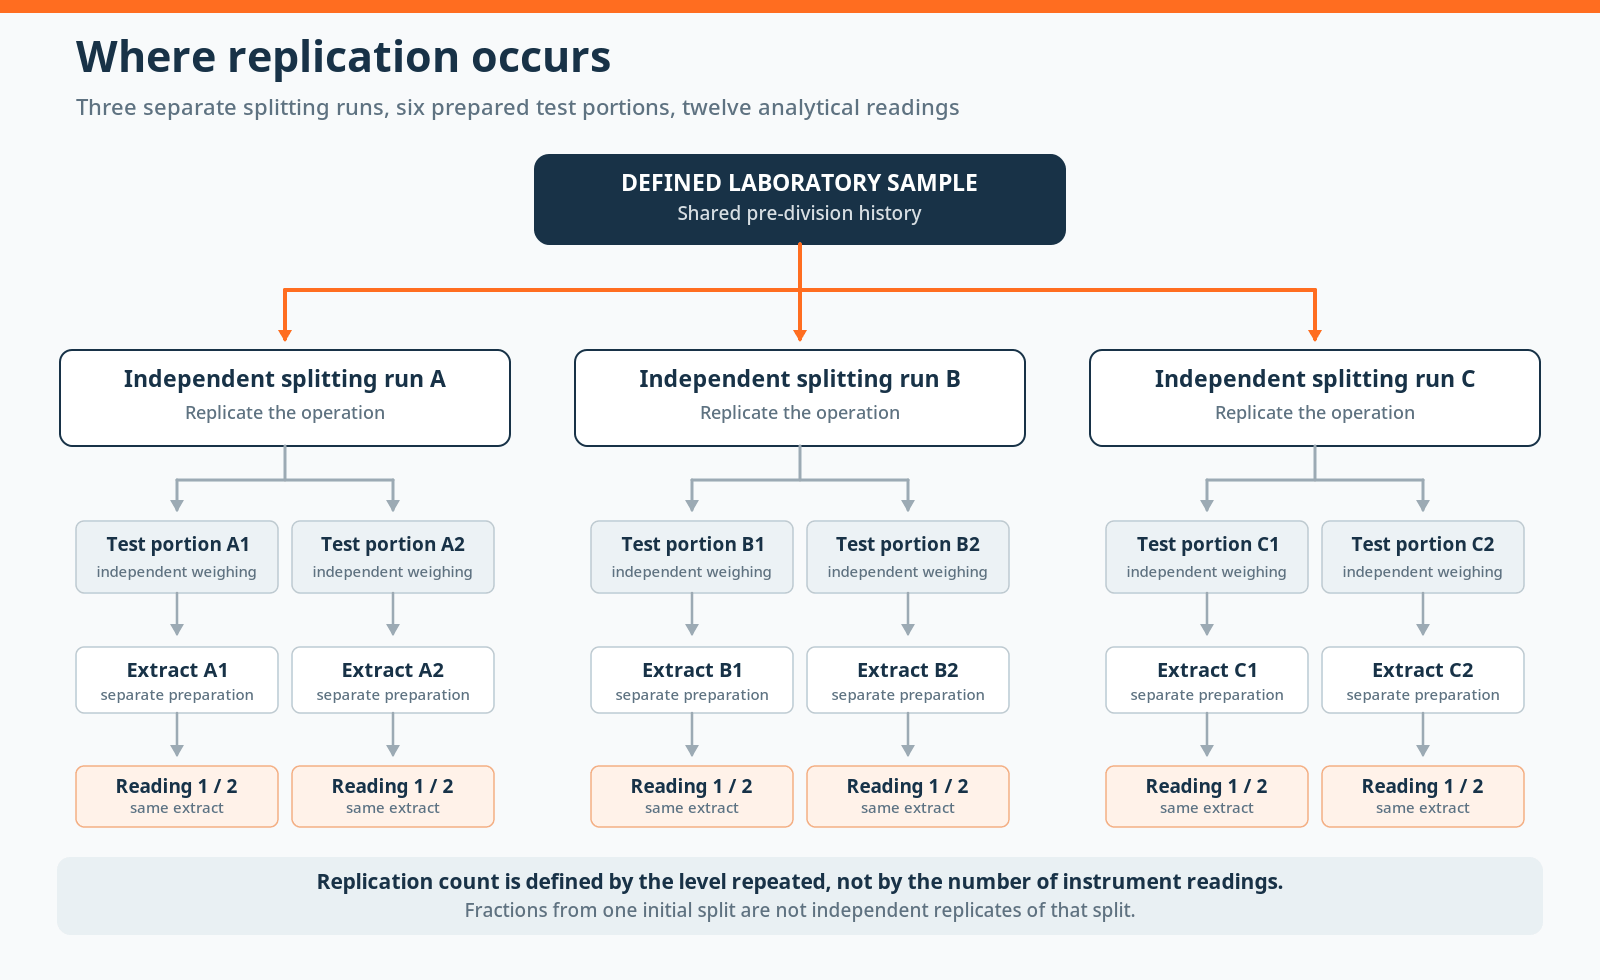
Three independently executed splitting runs produce six separately prepared test portions and twelve analytical readings. Replication at one level cannot substitute for replication at another. The diagram illustrates the hierarchy, not a universally sufficient number of replicates.
Nested analysis of variance, or a suitable hierarchical model, can estimate components associated with these levels [5].
The design must also represent conditions relevant to routine use. If analysts, days, equipment, or reagent batches contribute to routine variability, incorporate them appropriately. Balance or randomize analytical order across preparation paths so that instrument drift or batch effects are not confused with preparation differences.
Choose replication counts using the precision needed for the qualification decision. A design that produces a variance estimate does not necessarily estimate that variance precisely enough to support acceptance.
Run and Document the Study
Execute the approved study plan without changing the procedure or acceptance criteria in response to early results.
- Confirm the protocol. Verify the material, written procedure, acceptance criteria, reference suitability, analytical capability, replication structure, and statistical analysis plan.
- Document the starting material. Record its source, shared history, condition, mass, container, and any mixing or handling before independent paths begin.
- Replicate the preparation sequence. Follow the defined division and reduction steps. Record splitter configuration, feeding conditions, retained fractions, transfer losses, and deviations.
- Prepare separate test portions. Weigh and extract each portion independently. Retain its identity and connection to the corresponding preparation path.
- Perform analytical measurements. Record extracts, readings, calibration checks, blanks, recovery controls, measurement order, and reporting limits.
- Measure the reference. Follow the predefined comparison protocol and document the assigned value, uncertainty, preparation conditions, and potential shared sources of bias.
- Review controls and deviations. Investigate failures under the laboratory’s established rules. Retain original observations and the reasons for any exclusion.
Controls answer different questions. A preparation blank can identify contamination introduced by the procedure represented by that blank. It does not demonstrate analyte recovery from the powder. A recovery control assesses recovery under its stated conditions, while an instrument check provides evidence about analytical performance at the time of measurement.
None of these controls independently measures powder-splitting variability.
Physical observations are also useful. Uneven feeding, retained powder, visible agglomerates, and unexplained mass losses identify potential investigation points, although they do not by themselves quantify the effect on concentration.
Worked Example: Which Stage Controls the Result?
Consider a qualification study of a low-level constituent in a heterogeneous powder. The design contains three independently replicated preparation paths, two separately prepared test portions per path, and two readings from each extract.
For a balanced nested design, the variance of a routine result obtained by averaging n(p) independently prepared portions from one path and n(r) readings per portion can be expressed as:
σ²(routine) = σ²(path) + σ²(portion)/n(p) + σ²(reading)/[n(p) × n(r)]
The expression assumes an appropriate hierarchical random-effects model with independent components. Other preparation and reporting designs may require different calculations.
Suppose the study produces a mean concentration of 20 mg/kg. Nested variance-component analysis gives the following hypothetical estimates:
| Source of variation | SD (mg/kg) | Variance ((mg/kg)²) |
|---|---|---|
| Between preparation paths | 0.8 | 0.64 |
| Between portions within paths | 2.1 | 4.41 |
| Between readings of one extract | 0.6 | 0.36 |
Illustrative values only. These estimates are not derived from laboratory measurements.
What would a routine result look like?
If the routine procedure reports one test portion with one analytical reading, the estimated variance is:
0.64 + 4.41 + 0.36 = 5.41 (mg/kg)²
Therefore:
Routine SD = √5.41 = 2.33 mg/kg
At a mean concentration of 20 mg/kg, this represents approximately 11.6% relative standard deviation.
The between-portion component contributes about 82% of total variance. This directs the next investigation toward test-portion selection and preparation rather than immediately toward instrument repeatability.
However, that component includes multiple possible sources. The study has not separated intrinsic particle-selection variation from extraction-related variation.
Would a larger test portion help?
If fundamental sampling error dominates the portion-level component, doubling test-portion mass could approximately halve that component’s variance.
The hypothetical total variance would become:
0.64 + (4.41 / 2) + 0.36 = 3.205 (mg/kg)²
The predicted standard deviation would fall to 1.79 mg/kg. A controlled comparison at both masses is necessary to establish whether the improvement occurs.
Alternatively, averaging three independently prepared portions from the same path, with one reading per portion, gives:
√(0.64 + 4.41/3 + 0.36/3) = 1.49 mg/kg
The path-level component remains because the portions share that preparation path.
Does the mean agree with the reference?
Suppose an appropriate independent reference gives 21 mg/kg, with a standard uncertainty of 0.5 mg/kg.
The observed mean difference is:
20 − 21 = −1 mg/kg
For this balanced design, the estimated variance of the overall study mean is:
0.64/3 + 4.41/6 + 0.36/12 = 0.978 (mg/kg)²
Assuming the reference uncertainty is independent of the study estimate, the combined standard uncertainty of the mean difference is:
√(0.978 + 0.5²) = 1.11 mg/kg
Now suppose the predefined allowable mean difference is ±2 mg/kg, and the laboratory intends to demonstrate agreement using an uncertainty interval with an illustrative coverage factor of two.
The interval half-width would be:
2 × 1.11 = 2.22 mg/kg
With the observed difference of −1 mg/kg, the interval extends approximately from −3.22 to +1.22 mg/kg. It exceeds the allowable range.
More importantly, even if the observed mean difference were exactly zero, an interval extending ±2.22 mg/kg could not satisfy the ±2 mg/kg acceptance rule.
The estimated uncertainty is too large for that decision. If these variance levels had been anticipated, a precision calculation before the study would have exposed the risk that the design could not demonstrate acceptable agreement.
A formal uncertainty interval must also account for uncertainty in the estimated variance components. With only three independent paths, the path-level variance estimate rests on two degrees of freedom and is particularly uncertain.
The example therefore identifies a likely dominant source of variation, but it does not qualify the procedure. More independent replication, better measurement performance, or a justified redesign is needed before the acceptance decision can be made.
Estimate Variability and Compare the Mean
Begin by examining results grouped by preparation path and test portion. Compare them with the analytical sequence, control results, and recorded deviations.
Investigate unusual results before excluding them. A result should not be removed solely because it increases the estimated variability.
Fit the prespecified statistical model and report the components supported by the design. Express variance components in squared concentration units and their corresponding standard deviations in concentration units, together with suitable uncertainty estimates.
The routine reporting procedure determines how these components are combined. One independently prepared portion is not statistically equivalent to an average of several portions.
Check whether the model assumptions suit the observed data. Low-level measurements may be skewed, show unequal variances, or include results below quantitation limits. Conventional nested ANOVA is not automatically appropriate in those circumstances.
A component estimated near zero does not prove that the corresponding stage contributes no variation. Limited replication can produce wide uncertainty intervals or estimates constrained to a zero boundary.
Mean agreement is a separate decision
Calculate the difference between the study mean and the appropriate reference value:
Mean difference = Study mean − Reference value
Evaluate that difference using the predefined allowable range and an uncertainty assessment that respects the independent structure of the study.
Twelve analytical readings do not provide twelve independent estimates of splitting performance when they arise from only three preparation paths.
A mean difference that is not statistically distinguishable from zero does not demonstrate acceptable agreement. The plausible range of the difference must support the applicable acceptance decision [1].
Shared extraction, calibration, or preparation effects can also produce agreement between two procedures while leaving a common bias undetected.
Finally, distinguish qualification of the overall preparation and measurement procedure from qualification of the splitter alone. If the objective is specifically to compare splitter designs, the relevant downstream stages must be controlled so that differences can be attributed to the splitting procedures as far as the design permits.
Decide What to Change or Repeat
Accept the defined procedure only when the planned controls are satisfactory and the evidence supports both variability and mean-agreement criteria throughout the intended scope.
Record the material, concentration range, test-portion mass, equipment, operating conditions, procedure version, reference, and uncertainty of the estimates.
If qualification fails, the next action depends on where the evidence points.
Excessive analytical variation
Large differences between repeated readings of one extract direct attention toward the analytical measurement stage. Review instrument performance, calibration, short-term stability, and relevant controls before changing the splitting procedure.
Excessive portion-to-portion variation
Differences among independently prepared portions include variation in particle selection, sample preparation, extraction, and subsequent measurement.
Examine the constituent distribution, test-portion mass, particle-size characteristics, and preparation records. A controlled increase in portion mass may be informative when intrinsic particle-selection variation is suspected. Separating selection from extraction effects may require an additional experimental level.
Excessive preparation-path variation
If independently replicated preparation paths differ more than expected, inspect the complete splitting sequence.
Check feeding uniformity, splitter configuration, material retention, transfer losses, and the order of mixing and reduction.
Compare any revised procedure with the original under balanced conditions. If several changes are introduced together, an improvement in variability does not establish which change was responsible.
Unacceptable mean agreement
When the study mean differs excessively from the reference, examine reference suitability, blanks, recovery, preparation records, and possible shared biases.
Do not automatically attribute the difference to the splitter. A matched comparison using a suitable independent method or reference may help distinguish competing explanations.
Inconclusive evidence
Failed controls, excessive censoring, an unsuitable reference, or uncertainty too wide for the acceptance decision can make qualification inconclusive.
Identify what additional evidence is needed, revise the measurement or study design, and repeat the affected work with predefined acceptance criteria.
The objective is not to produce the smallest possible standard deviation. It is to establish whether the laboratory can obtain a sufficiently reliable result from the powder, at the required test-portion mass, for the decision the result must support.
Technical Basis / Sources
- H. Cantwell (ed.). The Fitness for Purpose of Analytical Methods: A Laboratory Guide to Method Validation and Related Topics. Third edition. Eurachem, 2025.
- M. H. Ramsey, P. D. Rostron, and F. C. Raposo (eds.). Validation of Measurement Procedures that Include Sampling. Eurachem/EUROLAB/CITAC/Nordtest/AMC Guide. First edition. Eurachem, 2024.
- M. H. Ramsey, S. L. R. Ellison, and P. Rostron (eds.). Measurement Uncertainty Arising from Sampling: A Guide to Methods and Approaches. Second edition. Eurachem, 2019.
- F. F. Pitard. Pierre Gy’s Sampling Theory and Sampling Practice: Heterogeneity, Sampling Correctness, and Statistical Process Control. Second edition. CRC Press, 1993. ISBN 9780849389177.
- H. El-Shall and B. M. Moudgil. “Design of Optimum Sampling Plans for Dry Powders and Slurries.” KONA Powder and Particle Journal, 31 (2014), 82–91.
- US Environmental Protection Agency. Guidance for Obtaining Representative Laboratory Analytical Subsamples from Particulate Laboratory Samples. EPA/600/R-03/027, 2003.