
Troubleshooting

Segregation and
blend inconsistency

Blend variation can arise from poor mixing, sifting,
trajectory effects, air-driven segregation, rolling,
or sampling bias

First verify that the variation is real and locate when it appears. Then relate the pattern
to differences in particle size, density, shape, cohesion, or charge, and to the motion
imposed by mixing, transfer, discharge, and filling.


Icon representing observed segregation and blend inconsistency patterns

By what you see

Blend is nonuniform at mixer discharge; composition changes by location; assay cycles during discharge; or samples disagree without a stable pattern.

Icon representing changed process or material conditions

By what changed

After mixing or discharge; after conveying, filling, or transfer conditions changed; or with changes in batch, PSD, composition, or material recycle fraction.

Icon representing likely segregation mechanisms

By likely mechanism

Poor mixing, sifting and percolation, trajectory effects, air-driven segregation, rolling segregation, or apparent variation introduced by process sampling bias.

Icon representing relevant diagnostic measurements

By measurement route

Choose the measurement that best separates poor mixing, true segregation during handling, and apparent variation introduced by sampling bias.

Find your route

Start with the observed failure, then add context

First verify that the variation is real and locate when it appears. Then relate the pattern to differences in particle size, density, shape, cohesion, or charge and to the motion imposed by mixing, transfer, discharge, and filling.

  1. 1Observation
  2. 2Change or context
  3. 3Route

Step 1  What are you seeing?

Step 2  What changed, or when does it happen?

A blend can be nonuniform because mixing never achieved uniformity, because a uniform blend segregated later, or because sampling makes the process look inconsistent. Use the event history to locate where the first reproducible shift appears.

Step 3  Your diagnostic route

Quick diagnostic comparison

Separate the leading routes before changing the process

Use the pattern and event history to select the first discriminating measurement. The table is a triage aid, not a substitute for reproducing the failed state.

Use the observed pattern and the event history to separate poor mixing, true segregation, and apparent variation from sampling. The pattern does not prove the mechanism.

What you observe What changed Likely route Measurement that separates it
Blend is already nonuniform at mixer discharge After blend time, fill level, addition order, or mixer settings changed Incomplete mixing or mixer-induced demixing Time-resolved, multi-location composition: Did uniformity never develop, or did it deteriorate before discharge?
Composition changes from top to bottom After filling, storage, refill, or discharge conditions changed Sifting and percolation or rolling segregation PSD plus stratified composition mapping: Do particle-size differences track the vertical gradient?
Composition varies across a container or stream After chute, drop height, fill point, or transfer geometry changed Trajectory or rolling segregation Location-resolved composition: Does the gradient follow the free-flight path or heap geometry?
Assay cycles during discharge or dosing After conveying, receiver, refill, or discharge conditions changed Air-driven segregation or zoned withdrawal Time-resolved composition with PSD and airflow context: Does assay track discharge fraction, refill, or aeration?
Results vary without a stable process or spatial pattern After the sampling point, tool, splitter, or handling procedure changed, or with no process trigger Sampling bias or analytical variation Sampling-system validation and replicate hierarchy: Can the method recover a known blend repeatably?

Use the measurement at the material state and process stage where the first reproducible composition shift appears.

Likely mechanisms

Separate poor mixing, true segregation, and sampling artefacts

A nonuniform result does not identify where uniformity was lost. Locate the first reproducible shift, then use the spatial or time pattern to distinguish incomplete mixing, relative particle motion, air-driven separation, and sampling bias.

Incomplete mixing or demixing

The blend may never reach uniformity, or prolonged or poorly matched mixing can begin to separate components before discharge.

Separate it with: time-resolved, multi-location composition before discharge.
Powder segregation diagnosis during mixing, conveying, and filling

Sifting and percolation

Finer particles can move through voids opened by coarser-particle motion, creating vertical or discharge-sequence gradients.

Separate it with: particle-size distribution and spatial composition mapping.
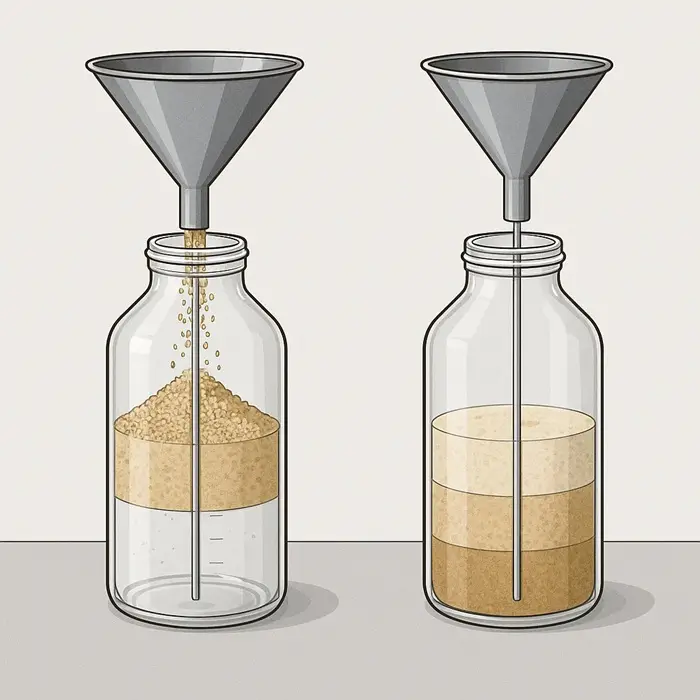
Powder segregation test: the 20 minute bottle method

Sampling bias

A probe, thief, scoop, splitter, or sampling location can misrepresent a heterogeneous stream and make the process appear more variable than it is.

Separate it with: replicate hierarchy and recovery of a known constructed blend.
Powder segregation: the 20 min. bottle method

Rolling segregation

Particles can separate on a moving free surface during heap formation, especially when size, density, shape, or friction differs between fractions.

Separate it with: controlled filling observation and location-resolved heap sampling.
Segregation mechanisms and prevention

Trajectory segregation

Differences in size, density, shape, or momentum can change particle flight and landing position during transfer or filling.

Separate it with: transfer-geometry trials and location-resolved sampling.
Segregation mechanisms and prevention

Air-driven segregation

Airflow can preferentially entrain fines or delay their settling relative to coarser fractions during conveying, filling, or receiver discharge.

Separate it with: permeability, airflow state, and timed composition sampling.
Dense-phase vs dilute-phase conveying

Measurement routes

Measure the contrast that can drive separation

Pair composition mapping with the material difference most likely to create relative motion. The strongest diagnosis connects where the composition shifts to a measurable contrast in particle size, density, morphology, flow, or air response.

Particle population

Use this route when size, shape, or density differences between components could explain sifting, trajectory, rolling, or settling behavior.

Mobility and air response

Use this route when discharge, conveying, free fall, receiver filling, or aeration changes which fraction moves or settles first.

Composition and sampling

Use time- and location-resolved composition to identify where uniformity is first lost, then challenge the sampling procedure before assigning the variation to the process.

Process context

Where uniformity is first lost changes what to check first

Follow the blend through the process in sequence. Sampling immediately before and after each major handling step is often more useful than measuring only the final container, because it identifies where the first reproducible composition shift appears.

01

Mixing and blending

The blend may leave the mixer nonuniform, or begin to demix during late mixing, discharge, or transfer from the vessel as particle-size or density differences become more influential.

02

Conveying and transfer

Particle trajectories, air entrainment, receiver settling, and repeated transfer points can separate fractions after a good blend has already been produced.

03

Storage and discharge

Funnel flow, uneven withdrawal, refill sequence, and residence can expose or intensify gradients that were not obvious upstream.

04

Feeding and dosing

A segregated feeder inlet converts spatial composition differences into time-dependent formulation or dose variation.

05

Filling and packaging

Free fall, heap formation, fill-point geometry, and repeated drops can create radial or vertical gradients in the finished container.

06

Size reduction and classification

Milling, screening, classification, or recycle can change particle-size fractions upstream and alter the segregation tendency of the blend.

Go deeper

Guides and articles for segregation and blend inconsistency

Use the deeper technical material to locate where uniformity is lost, identify the physical segregation mechanism, and choose a practical way to challenge the diagnosis.

Powder segregation during mixing, conveying, and filling

Powder Segregation Diagnosis During Mixing, Conveying, and Filling

Shows how to locate where uniformity is first lost and distinguish poor mixing, sifting, fluidization, trajectory effects, and sampling problems.

Powder segregation mechanisms during blending and transport

Segregation Mechanisms and Prevention in Blending and Transport

Explains the main segregation mechanisms and how handling, filling, transport, and storage conditions can strengthen or reduce them.

Granules in glass bottles used for a powder segregation test

Powder Segregation Test: The 20 Minute Bottle Method

Provides a practical bench-scale way to compare segregation tendency and observe how a blend redistributes under controlled handling.

Understand segregation

Use the Particle Behavior child for the particle and material contrasts that make relative movement possible.

Segregation articles

Browse published PTI articles covering segregation mechanisms, diagnosis, testing, and prevention.

Particle size & morphology

Compare the Test Methods family used to quantify size and shape differences that can drive segregation.

Mixing & blending

Follow the Process & Equipment child when mixer operation, blending, or discharge is the central issue.

FAQ

Segregation and blend inconsistency questions

Sample the blend at the mixer discharge before downstream handling, then repeat the composition measurements after transfer, storage, or filling. If the blend is already nonuniform at mixer discharge, investigate mixing first. If uniformity is lost later, the downstream step is the stronger segregation candidate.[/fusion_toggle]
Differences in particle size, density, shape, cohesion, and surface or electrostatic behavior can change how components move relative to one another. The important property is the contrast between fractions under the actual handling motion, not a single property measured in isolation.
Sifting and percolation often create a size-linked vertical or discharge-sequence gradient as fines move through voids between coarser particles. Particle-size distribution and location-resolved composition are useful discriminators.
Yes. Air entrainment, different settling velocities, receiver flow patterns, and particle trajectories can redistribute fractions during conveying and receiver discharge. Compare composition and particle-size distribution immediately before and after the transfer step.
A probe, thief, scoop, splitter, or poorly chosen sampling location can over- or under-represent part of a heterogeneous stream. Replicate sampling and recovery of a known constructed blend help determine whether the sampling system itself is contributing to the apparent variation.
Start with time- and location-resolved composition to identify where uniformity is first lost. Then compare particle size and morphology, density and packing, powder flow, and permeability or aeration response according to the mechanism suggested by the process pattern.

Independent diagnostic support

Need the measurement, not just the guidance?

PowderTechnology.info works closely with Delft Solids Solutions, a contract research organization specializing in the physical behavior of powders and granules. DSS provides contract testing and characterization, with its laboratory working in accordance with ISO 17025. Contact Delft Solids Solutions.