
Troubleshooting

Slurry, settling and dewatering problems

Settling, phase separation, viscosity drift,
and slow dewatering reflect different
particle-liquid structures
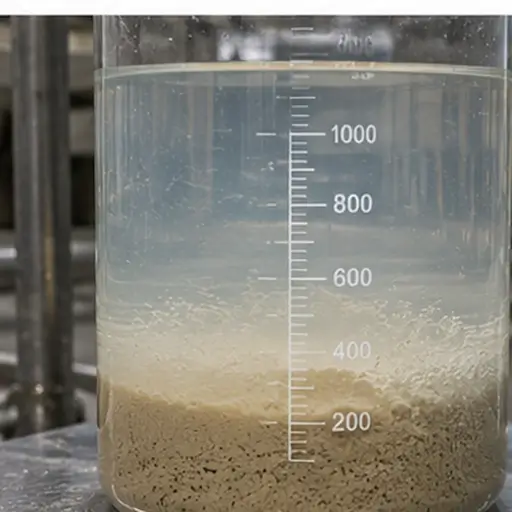
Characterize the time dependence before changing formulation or equipment.
Separate settling kinetics, flocculation, gel-network support, time-dependent
structure change, sediment compaction, and cake permeability under the
conditions that produced the failure.


By what you see

By what you see

A clear layer forms rapidly; sediment packs hard and resists redispersion; viscosity drifts during hold; or dewatering slows despite pressure.

By what changed

By what changed

After make-down or storage; after shear, temperature, solids loading, or transfer changed; or with changes in batch, PSD, chemistry, formulation, or recycle.

By likely mechanism

By likely mechanism

Free or hindered settling, flocculation, gel-network support, time-dependent structure change, dense sediment formation, or low cake permeability.

By measurement route

By measurement route

Choose measurements that separate settling, structural rheology, particle-state change, sediment compaction, and cake permeability under failure conditions.

Find your route

Start with the observed failure, then add context

Characterize the time dependence before changing formulation or equipment. Distinguish free settling, flocculation, yield-stress support, density mismatch, particle-size change, gelation, and cake permeability.

  1. 1Observation
  2. 2Change or context
  3. 3Route

Step 1  What are you seeing?

Step 2  What changed, or when does it happen?

The same slurry symptom can come from a different mechanism after make-down, hold, agitation, pumping, temperature or chemistry changes, or a shift in the particle population.

Step 3  Your diagnostic route

Quick diagnostic comparison

Separate the leading routes before changing the process

Use the pattern and event history to select the first discriminating measurement. The table is a triage aid, not a substitute for reproducing the failed state.

Use the observed pattern and the change that preceded it to select the first discriminator. The pattern does not prove the mechanism.

What you observeWhat changedLikely mechanismMeasurement that separates it
A clear layer forms rapidlyAfter make-down, solids loading, or temperature changedFree or hindered settling, or flocculationSettling profile: Track interface height, supernatant clarity, and solids distribution with time.
Sediment compacts and is difficult to redisperseAfter hold time, agitation history, or particle population changedDense sediment formationSediment volume and redispersibility: Track compaction with hold time and the energy needed to redisperse the bed.
Viscosity rises or falls during holdAfter hold time, shear history, temperature, pH, or chemistry changedTime-dependent structure change or gel-network supportRheology and recovery: Measure viscosity or yield stress versus time and recovery after controlled shear.
Filtration or drainage slows despite pressureAfter PSD, solids loading, pumping, or filtration conditions changedLow cake permeability or compressibilityPressure-dependent filtration and cake analysis: Compare flux with cake thickness and applied pressure.

Use the measurement under the slurry state, time, shear, temperature, and pressure conditions that produced the failure.

Likely mechanisms

What can create this slurry failure

Separate settling behavior, particle interactions, rheological support, time-dependent change, sediment compaction, and cake resistance before changing formulation or equipment.

Free or hindered settling

Particle size, density difference, solids concentration, and continuous-phase viscosity determine how rapidly particles or flocs leave suspension.

Separate it with: a time-resolved settling profile at the actual solids loading, temperature, and liquid composition.
The Complete Guide to Powder Dispersion and Data Interpretation

Time-dependent structure change

Hydration, thixotropy, reaction, gelation, breakage, or temperature can change slurry structure during hold.

Separate it with: time sweeps under controlled temperature, solids loading, and shear history.
The Complete Guide to Powder Dispersion and Data Interpretation

Dense sediment formation

Fine or broadly distributed particles can pack into a low-porosity bed that strengthens during hold and becomes difficult to redisperse.

Separate it with: sediment height, solids concentration, hold time, and the energy needed for redispersion.

Flocculation and aggregation

Particle interactions create larger structures that can settle quickly, trap liquid, or rebuild after shear.

Separate it with: time-resolved settling, wet particle size, and rheology under matched liquid chemistry.
When Paint Passes Color QC but Fails in Application

Yield-stress or gel-network support

A continuous structure can arrest particles until gravity or applied stress exceeds the network strength.

Separate it with: low-shear rheology, yield behavior, and recovery after a controlled shear history.
When Paint Passes Color QC but Fails in Application

Low cake permeability or compressibility

Fines migration, pore blockage, and cake compression can restrict liquid flow as filtration or drainage proceeds.

Separate it with: pressure-dependent filtration, flux decline, cake thickness, and cake structure.

Measurement routes

Measure the uncertainty, not the symptom

Use time-resolved measurements under the failed slurry state to separate settling, particle-state change, structural rheology, sediment compaction, and filtration resistance.

Settling & particle state

Track interface height, clarity, solids distribution, and wet particle state to distinguish free settling, flocculation, and changing agglomerate structure.

Rheology & recovery

Measure viscosity, low-shear structure, yield behavior, and recovery after controlled shear to determine whether a network supports or rebuilds the suspension.

Filtration & cake response

Follow flux, pressure, cake thickness, and solids retention to separate pore blockage, fines migration, and cake compressibility from upstream slurry instability.

Process context

Where the slurry changes determines what to check first

Keep solids loading, liquid chemistry, shear history, residence time, temperature, pressure, and recycle history attached to the failed state.

01

Slurry make-down

Addition sequence, wetting, dispersion energy, and local solids loading establish the initial particle-liquid structure.

02

Agitated storage

Residence time, agitation, dead zones, and temperature determine whether settling, hydration, or structure rebuilds during hold.

03

Pumping & transfer

Pump shear, pressure, residence time, and temperature can break flocs, rebuild structure, or shift particle state.

04

Filtration & dewatering

Cake build, compression, fines migration, and filter-medium loading determine liquid removal rate and throughput.

05

Feeding & solids addition

Feed-rate variation changes local solids loading and can shift wetting demand, viscosity, flocculation, and settling behavior.

06

Recycle & recirculation

Repeated circulation changes shear exposure, residence history, fines content, and the structure presented to separation equipment.

Go deeper

Guides and articles for slurry instability and separation

Use the deeper material to investigate dispersion state, rheological structure, settling behavior, and the particle-liquid interactions that feed into dewatering performance.

Powder dispersion and suspension stability analysis

The Complete Guide to Powder Dispersion and Data Interpretation

Connects preparation, stabilization, particle-size response, viscosity, settling, and suspension stability to practical interpretation.

Paint dispersion and application quality control

When Paint Passes Color QC but Fails in Application

An applied example of how flocculation, viscosity drift, particle state, and storage stability can reveal a slurry failure that simple composition checks miss.

Powder wettability and reconstitution in food and feed systems

Inside Perspective of Powder Wettability in the Food and Feed Industries

Shows how wetting, hydration, agglomeration, and reconstitution conditions establish the particle-liquid state before settling and rheology are assessed.

Sedimentation

Follow the Particle Behavior child for settling rate, clarification, density contrast, and suspension stability.

Slurry rheology

Follow the Particle Behavior child for viscosity, yield behavior, shear response, and time-dependent slurry structure.

Liquid-phase testing

Use the Test Methods family for dispersion, sedimentation, rheology, and stability measurements in the liquid state.

Cake & permeability

Use the permeability family when resistance, pressure drop, cake structure, or dewatering behavior becomes the controlling uncertainty.

FAQ

Slurry, settling, and dewatering questions

Start with a time-resolved settling profile under the failed solids loading, temperature, and liquid chemistry. Record interface height, clarity, and sediment development before changing the formulation. Then add particle-size or rheology measurements if the settling pattern suggests flocculation, particle-state change, or structural support.
Compare wet particle state with the settling profile and, where useful, the response to controlled shear or liquid-chemistry changes. Large primary particles and weakly bound flocs can produce similar visual settling rates, but their particle-size response and reversibility are different.
A yield-stress or gel network can temporarily support particles even when the underlying particle-liquid interactions are changing. A slurry can therefore resist visible settling while its viscosity, structure, or recovery behavior drifts during hold.
Fine particles, broad size distributions, floc structure, high solids loading, and long hold times can produce a dense bed with low porosity and increasing contact between particles. Measure sediment development and redispersibility with the actual hold history rather than judging only the initial settling rate.
If the cake is compressible, added pressure can reduce pore size and increase hydraulic resistance. Fines migration, filter-medium blinding, and increasing cake thickness can also reduce flux, so pressure alone does not identify the controlling mechanism.
Characterize the upstream slurry state first with settling, particle-state, and rheology measurements. Then measure filtration response, pressure, flux, cake thickness, and solids retention. This separates instability already present in the feed from resistance that develops mainly during cake formation.

Independent diagnostic support

Need the measurement, not just the guidance?

PowderTechnology.info works closely with Delft Solids Solutions, a contract research organization specializing in the physical behavior of powders and granules. DSS provides contract testing and characterization, with its laboratory working in accordance with ISO 17025. Contact Delft Solids Solutions.