Two laboratories receive samples of the same powder and report different BET surface areas. One laboratory used a higher degassing temperature for longer. It seems reasonable to trust the more thoroughly degassed sample. Should you?
Why Degassing Changes the Measurement
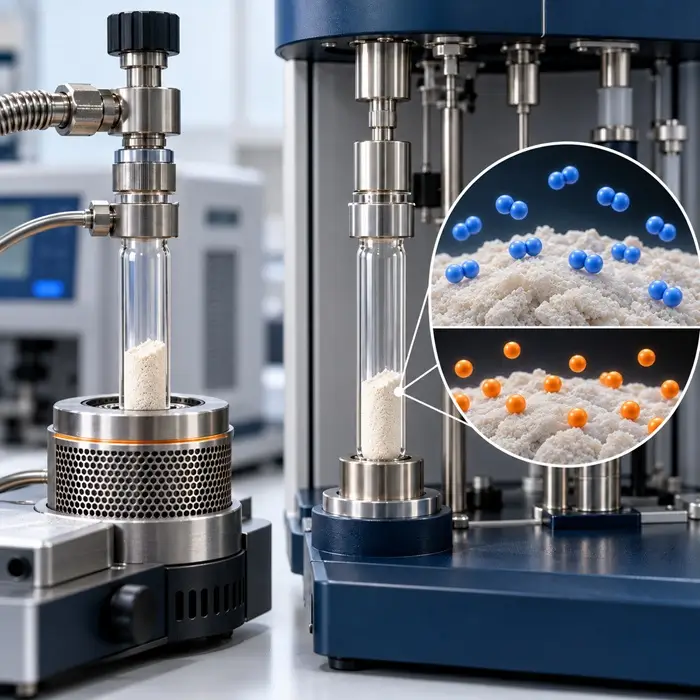
Before measuring BET surface area, laboratories remove adsorbed water and other volatile substances using vacuum or flowing inert gas. Without this preparation, residual molecules interfere with gas adsorption and affect the calculated surface area. The difficulty is knowing when cleaning becomes material alteration. For a hydrated powder, increasing the temperature can remove water that is part of its crystal structure rather than simply water adsorbed on the surface. Surface chemistry and pore accessibility can also change during treatment. ISO 9277:2022, Section 6.1, calls for removing physically adsorbed material without irreversibly changing the surface. Finding suitable conditions may require TGA, spectroscopy, or testing different degassing temperatures and durations, particularly for materials whose structure changes during heating.
What Magnesium Stearate Reveals
Lapham and Lapham (2017) measured a nitrogen BET surface area of 5.6 m²/g for magnesium stearate monohydrate degassed at 40°C. Increasing the temperature to 100°C reduced the result to 3.2 m²/g. Dihydrate-containing samples showed an even larger difference, with reported values of 23.9 and 5.9 m²/g under comparable degassing conditions. The nitrogen adsorption data give reason to question the higher dihydrate result. Before dehydration, the samples showed atypical adsorption behavior, with BET C values below 7 and correlation coefficients below 0.98. These abnormalities became less pronounced after dehydration, suggesting that the original 23.9 m²/g result reflected more than the accessible surface area. In a 2019 follow-up, the researchers compared nitrogen and krypton adsorption. Ten samples from the same dihydrate-containing batch produced the following mean BET surface areas:
| Adsorptive gas | Mean BET surface area |
|---|---|
| Nitrogen | 23.18 m²/g |
| Krypton | 6.78 m²/g |
The difference was attributed to structural swelling and adsorbate encapsulation during nitrogen adsorption. With krypton, these effects occurred at higher adsorption pressures, allowing a more representative measurement. For these samples, the approximately 6 m²/g result was therefore better supported. Degassing can also change the solid itself. Koivisto et al. (2004) found that vacuum degassing magnesium stearate hydrates at 105°C for two hours converted them to the anhydrous form, as confirmed by thermal analysis and X-ray diffraction. These are two separate failure modes: a sample that changed during preparation, and a measurement that misrepresents its surface.
Four Checks When BET Results Disagree
1. Look Beyond the Reported Surface Area
Ask for the full adsorption isotherm, the pressure range used for the BET calculation, the C value, and the regression diagnostics. Pay particular attention to the low-pressure region and how the fitting range was selected. A reasonable-looking regression does not guarantee a valid surface area when the underlying adsorption behavior is unusual.
2. Compare What Each Laboratory Actually Did
Check the degassing temperature, duration, heating rate, vacuum or purge conditions, and criteria used to determine completion. Confirm that the calculation uses the degassed sample mass. A fixed treatment time does not establish that all unwanted adsorbates have been removed. Pressure or mass stabilization provides a useful endpoint indication, although it cannot confirm that the material’s original structure remains intact.
3. Check Whether the Sample Changed
TGA can reveal mass losses during heating, while differential scanning calorimetry (DSC), X-ray diffraction (XRD), or spectroscopy can help identify changes in hydration, phase, or chemistry. The distinction matters particularly for hydrated materials. Removing physically adsorbed surface water is not the same as removing water from a crystal structure.
4. Establish Which Result Represents the Material
Test separate, representative samples under controlled pretreatment conditions and compare their isotherms, BET fits, mass losses, and structural stability. If the adsorption behavior remains unusual after suitable degassing, consider whether the adsorptive gas is contributing to the problem. The right result is the one that represents the material state the analysis is meant to characterize, measured with a pretreatment and gas that preserve it. For the two laboratories in the opening example, the disagreement cannot be resolved by choosing whichever sample received the more aggressive treatment.
Frequently Asked Questions
Technical Basis / Sources
– ISO 9277:2022. Determination of the specific surface area of solids by gas adsorption — BET method. – Lapham, D. P., and Lapham, J. L. (2017). Gas adsorption on commercial magnesium stearate: Effects of degassing conditions on nitrogen BET surface area and isotherm characteristics. International Journal of Pharmaceutics, 530(1–2), 364–376. – Lapham, D. P., and Lapham, J. L. (2019). BET surface area measurement of commercial magnesium stearate by krypton adsorption in preference to nitrogen adsorption. International Journal of Pharmaceutics, 568, 118522. – Koivisto, M., Jalonen, H., and Lehto, V.-P. (2004). Effect of temperature and humidity on vegetable grade magnesium stearate. Powder Technology, 147(1–3), 79–85.