Two laboratories analyze the same powder batch. Their particle size distributions agree, but their reported circularities differ. This would usually be interpreted as a difference in particle irregularity. It may equally reflect different descriptor definitions or contour-measurement methods. Similar area-based particle sizes alongside different circularities are a clue that perimeter estimation deserves attention.
What Does the Threshold Actually Change?
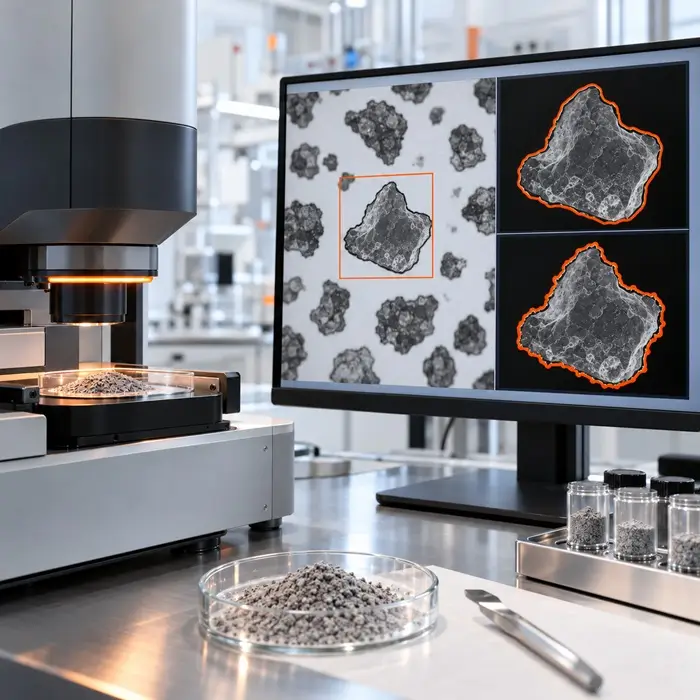
Dynamic image analysis (DIA) converts grayscale images of moving particles into segmented silhouettes. For dark particles against a bright background, shifting the threshold toward the background gray level expands the silhouette; shifting it toward darker intensities erodes the boundary.
This shift can alter projected area, perimeter, and particle counts. A boundary may include a halo, lose a fine protrusion, or merge neighboring particles. NIST research on flow imaging of translucent pharmaceutical particles demonstrated how halos and variable transparency distort boundary detection. Although the study did not examine powders, the optical mechanism is relevant to DIA.
Why Is Perimeter Estimation So Important?
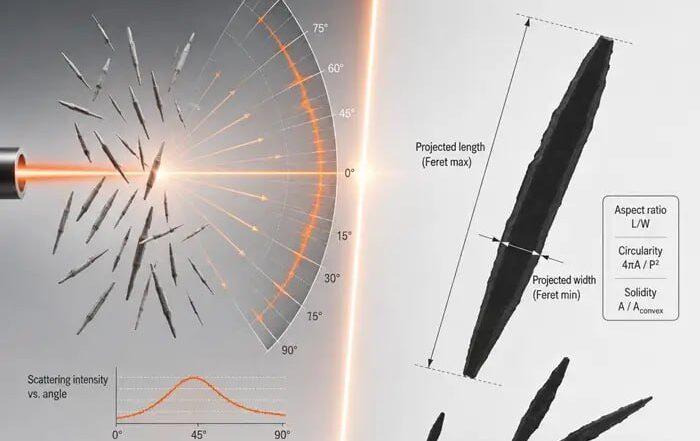
Circularity responds strongly to how software traces particle edges. Different contour algorithms can return different perimeters from the same binary image. At low resolution, a particle occupies relatively few pixels, making its stepped contour a poor approximation of its actual boundary. Perimeter-based descriptors may then shift more than area-based size measurements.
Đuriš and colleagues studied scanned quartz filtration sand images and reported a minimum particle-to-pixel-size ratio of 20 under their experimental conditions. Laboratories should validate their own minimum resolution for reliable shape reporting.
Which Circularity Is Being Reported?
Circularity is not universally defined. ISO 9276-6 distinguishes form factor from circularity:
Form factor (FF) = 4πA/P²
Circularity (C) = 2√(πA)/P = √FF
Here, A is projected area and P is perimeter. Malvern Panalytical calls the squared expression high-sensitivity (HS) circularity; Sympatec uses the square-root expression for two-dimensional sphericity.
With area unchanged, a 10% increase in measured perimeter lowers form factor by 17.4% but square-root circularity by only 9.1%. Both results can describe the same contour. Convexity, calculated from convex-hull perimeter divided by particle perimeter, also depends on perimeter. Solidity uses projected area divided by convex-hull area; because it excludes perimeter, it is generally less sensitive to fine contour noise, although thresholding can change both areas.
Three Checks Before Blaming the Powder
1. Verify Definitions and Reporting Rules
Confirm the descriptor formula, perimeter algorithm, contour smoothing, and software version. Use comparable number- or volume-weighted distributions and identical minimum-size cutoffs; otherwise, the two analyses may represent different particle populations.
2. Inspect the Particle Outlines
Overlay detected contours on representative grayscale images, including small and irregular particles. Look for missing protrusions, halos, merged silhouettes, and weakly defined edges. Check focus, depth of field, and motion blur, which ISO 13322-2:2021 addresses for DIA.
3. Isolate Image-Processing Effects
Where possible, reprocess identical stored images with alternative threshold settings, holding all other parameters constant. Compare area, perimeter, circularity, and accepted particle counts. If images cannot be exchanged, analyze a suitable shape reference, such as near-spherical glass beads, on both instruments. This checks agreement but cannot exclude powder-specific segmentation bias.
When Is a Shape Change Real?
If discrepancies disappear after harmonizing definitions and processing, a manufacturing explanation is premature. If differences persist with a validated, comparable method, investigate changes caused by milling, agglomeration, or crystallization.
Decision rule: Compare the same descriptor, then verify the boundaries before interpreting the shape.
Frequently Asked Questions
Technical Basis / Sources
- ISO 13322-2:2021. Particle size analysis — Image analysis methods — Part 2: Dynamic image analysis methods.
- ISO 9276-6:2008. Representation of results of particle size analysis — Part 6: Descriptive and quantitative representation of particle shape and morphology.
- Malvern Panalytical. Morphological Comparison of Pharmaceutical Excipients. Application note defining circularity and HS circularity.
- Sympatec. Particle Shape. Definition of two-dimensional sphericity.
- Cavicchi et al. (2017). Variable Threshold Method for Determining the Boundaries of Imaged Subvisible Particles. Journal of Pharmaceutical Sciences, 106, 1499–1507.
- Đuriš et al. (2016). Optimal Pixel Resolution for Sand Particles Size and Shape Analysis. Powder Technology, 302, 177–186.