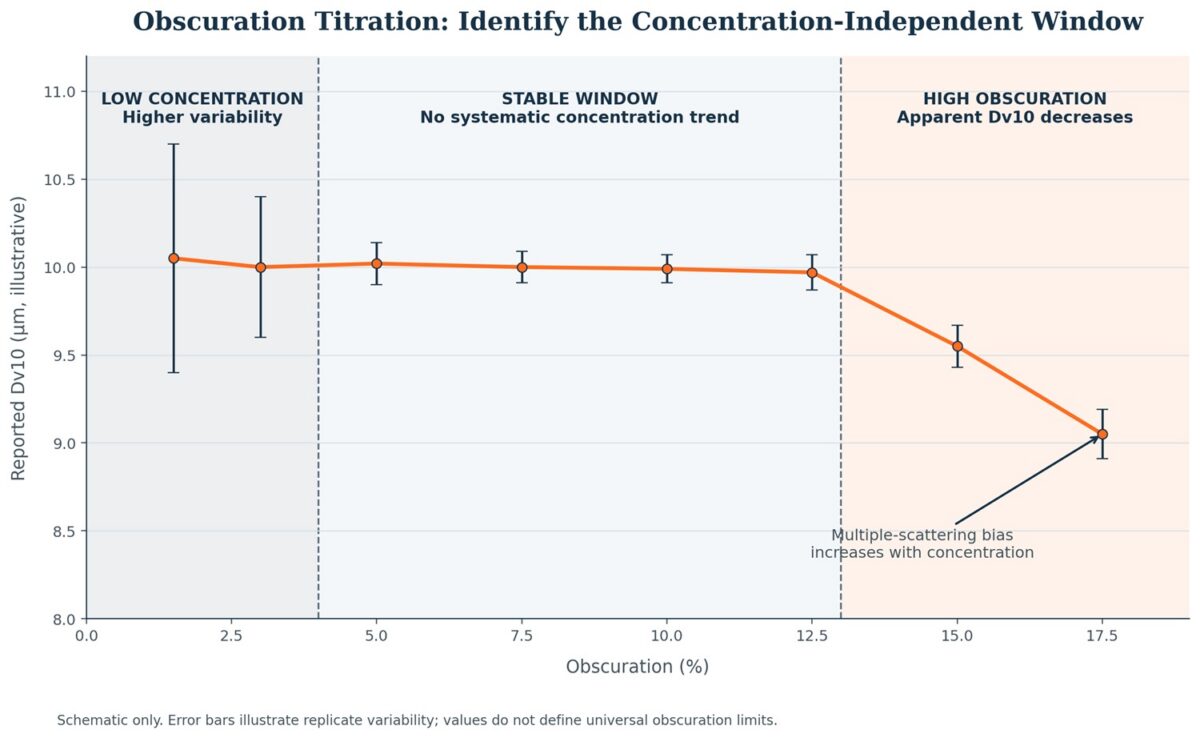
Figure 1. Illustrative obscuration titration showing larger replicate variability at low concentration, a concentration-independent measurement window, and an apparent decrease in Dv10 as multiple scattering becomes significant at higher obscuration. Error bars represent illustrative replicate variability; values do not define universal obscuration limits.
A laser diffraction result can appear to become finer simply because more sample is present in the measurement zone. If Dv10 falls or a new fine-particle shoulder appears as obscuration rises, the first assumption should not be that dispersion has improved or the product has changed. The measurement itself may be moving outside its reliable concentration range.
Why High Obscuration Can Bias the PSD
Laser diffraction converts the angular pattern of scattered light into an equivalent particle size distribution. The calculation assumes, to a useful approximation, that detected light has interacted with one particle before reaching the detector.
At sufficiently high particle concentration, light can scatter from more than one particle before reaching the detector. This is multiple scattering.
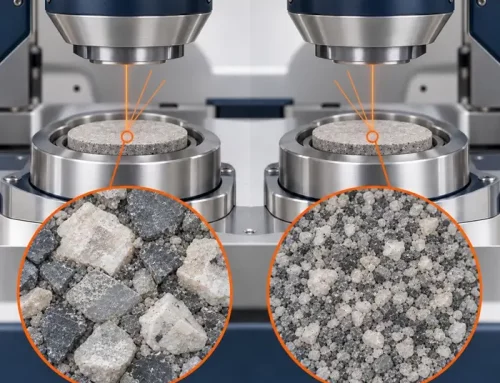
Multiple scattering can redirect light toward wider angles. Because smaller particles produce proportionally more wide-angle scattering than larger particles, the inversion algorithm may interpret part of that additional signal as smaller particles. The reported distribution can therefore develop an exaggerated fine fraction even though the physical particles have not changed.
Obscuration is commonly used as an indicator of optical concentration. It represents the reduction in laser light reaching the detector because of scattering and absorption, but it is not a direct measure of mass concentration. Particle size, refractive index, absorption, and instrument geometry all influence the useful obscuration range.
False Fines or Genuine Dispersion?
Real deagglomeration can also shift a particle size distribution toward smaller sizes. Breaking weak agglomerates exposes smaller particles that were already present, so a reduction in Dv10 or Dv50 can be physically genuine.
A useful discriminator is what happens when concentration is subsequently changed.
If changing sonication, dispersion pressure, or another dispersion condition produces a finer distribution, and that new distribution remains stable across an appropriate concentration series, genuine deagglomeration is plausible.
If the apparent fine shift becomes stronger as obscuration increases and then disappears again when the sample is diluted, multiple scattering is the stronger explanation.
How to Run an Obscuration Check
Keep the optical model and dispersion conditions fixed while changing only the amount of material passing through the measurement zone.
For wet dispersion, a practical approach is to add sample stepwise to the same well-mixed dispersion, allowing several progressively higher obscuration levels to be measured without changing the dispersant or dispersion conditions.
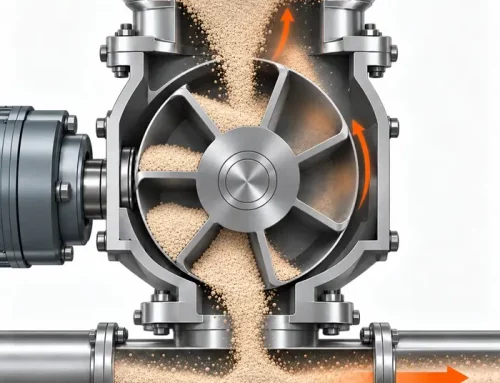
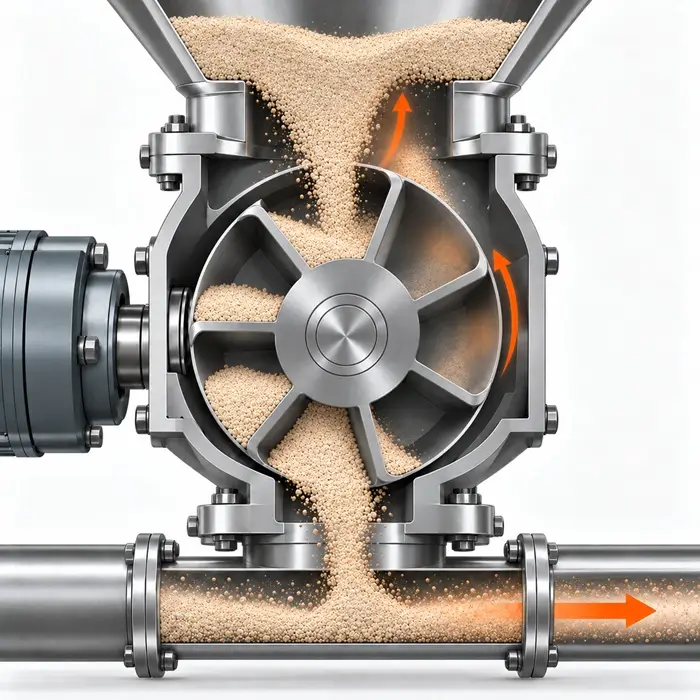
For dry dispersion, concentration cannot be adjusted in the same direct way. Obscuration is controlled through sample delivery, particularly feed rate and feeder configuration. The feed should be adjusted so that obscuration remains within the selected range for most of the measurement rather than producing short concentration spikes. Hopper or tray configuration may also need adjustment to obtain stable powder flow.
As a practical PTI method-development starting point:
- Measure four to six concentration levels, progressing from low to high.
- Run three repeat measurements at each level during the exploratory study.
- Record Dv10, Dv50, Dv90, and the full distribution shape.
- Plot the size metrics against obscuration.
- Identify the region where there is no systematic trend with increasing concentration.
For dry measurements, also inspect obscuration versus time. A nominal obscuration value is less useful if the powder feed repeatedly moves in and out of the target range during the measurement.
The low end matters because insufficient particle concentration can reduce the signal-to-noise ratio or make sampling less representative. At the high end, multiple scattering can progressively bias the calculated distribution toward smaller sizes. The useful method window lies between those two effects.
ISO 13320:2020 repeatability should be assessed separately. For six measurements, no individual Dv10 result should deviate from the mean of the six results by more than ±3%, Dv50 by more than ±2.5%, and Dv90 by more than ±4%. These are repeatability criteria under defined measurement conditions. They are not an ISO-defined acceptance limit for the difference between individual obscuration levels.
Where Should You Start?
There is no universal obscuration setting for every powder and every instrument, but vendor guidance can provide a sensible starting point for method development.
For the Mastersizer platform, Malvern Panalytical recommends approximately 1–5% obscuration for wet measurements of particles from 0.01–1 µm, 5–10% for 1–100 µm, and 10–20% for 100–3500 µm. For dry analysis, it gives approximately 0.5–5% for cohesive fine particles and 1–8% for more easily dispersed coarser particles.
These are instrument-specific starting ranges, not universal acceptance criteria. The appropriate range must still be demonstrated for the material, dispersion state, and measurement configuration being used.
For dry measurements, concentration optimization also should not be confused with dispersion-pressure optimization. PTI covers that separate question in Laser Diffraction Troubleshooting: Pressure Titration for Reliable PSD.
Technical Basis / Sources
-
- ISO 13320:2020, Particle size analysis: Laser diffraction methods. Provides the international framework for laser diffraction measurement, method development, concentration effects, measurement precision, and repeatability.
- USP <429>, Light Diffraction Measurement of Particle Size. States that particle concentration must be high enough to provide adequate signal-to-noise ratio but low enough to avoid multiple scattering, and that measurements at different concentrations should be used to establish an appropriate range.
- Ph. Eur. 2.9.31, Particle size analysis by laser light diffraction. Provides the European Pharmacopoeia framework for laser diffraction measurement and forms part of the pharmacopoeial harmonization work for this method.
- Malvern Panalytical, Laser Diffraction for Particle Sizing: Sample Concentration/Dilution. Provides particle-size-dependent starting ranges for wet and dry obscuration and explains why the appropriate range changes with particle size and optical properties.
- Malvern Panalytical, Dry Powder Method Development for Laser Diffraction Particle Size Distribution Measurements. Explains how dry-feed rate, obscuration control, measurement duration, and feeder or hopper configuration affect the stability and reproducibility of dry laser diffraction measurements.