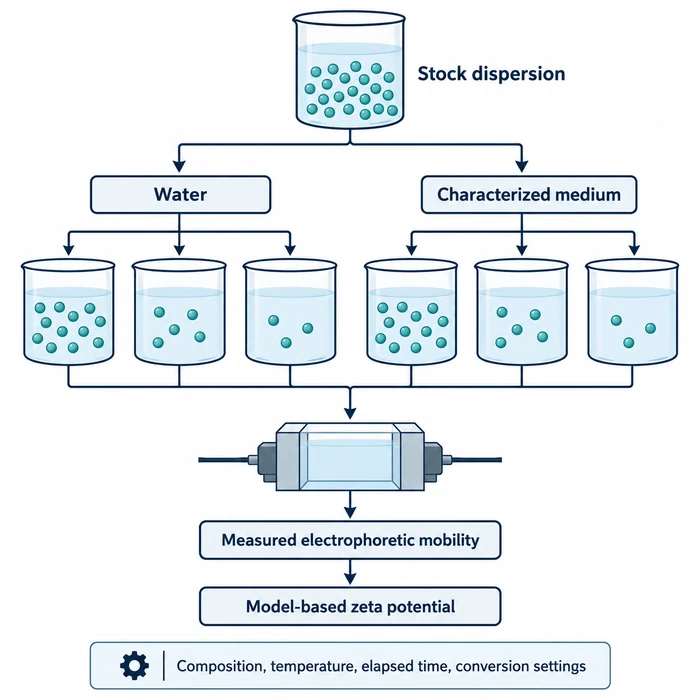
Investigation design: compare corresponding solids concentrations while documenting medium chemistry, measured mobility, and conversion settings. No experimental results are depicted.
A dispersion gives one zeta-potential result before dilution and another after adding water. Before changing the formulation, ask whether the preparation changed the liquid surrounding the particles, the measurement conditions, or the calculation used to report zeta potential. A paired dilution comparison provides a practical way to investigate these possibilities.
Why Water Can Change the Result
Zeta potential depends on the particle–liquid interface. Dilution with water can change pH, specific-ion concentrations, and dissolved additive concentrations, affecting interfacial charging and adsorption. Dilution can also promote dissolution. Atmospheric CO₂ can shift the pH of poorly buffered dilution water. Record pH after dilution and compare preparations with controlled air-exposure times to investigate whether this affects the result. ISO/TR 19997:2018 therefore emphasizes preserving both the particle surface and an electrochemically equivalent medium when the diluted measurement is intended to represent the original dispersion.
This matters especially when surfactants or polymers contribute to stabilization. PTI’s explanation of detachment and stabilization distinguishes breaking agglomerates apart from keeping particles separated. Water dilution also lowers the concentration of free, unbound additive in solution, which can shift the adsorption equilibrium at the particle surface without necessarily stripping already-adsorbed material.
Matching pH and conductivity alone does not establish matching composition. Conductivity does not identify individual ions or quantify free polymer and surfactant. A reconstructed medium needs a documented composition, including relevant additives. Separated continuous phase is another candidate, provided its preparation and suitability are checked; separation itself does not demonstrate that the interface remains unchanged.
Keep Mobility Separate From Zeta Potential
Optical electrophoresis determines electrophoretic mobility, the particle velocity per applied electric field; zeta potential is calculated from it using a theoretical model, and ISO 13099-2:2025 explicitly distinguishes the two. Conversion depends on viscosity, permittivity, and the model’s assumptions, including κa, the ratio of particle radius to double-layer thickness. Lower ionic strength increases double-layer thickness and reduces κa. Within the applicable Henry model, using the Smoluchowski limit at low κa underestimates zeta-potential magnitude for a given mobility. Check model suitability separately from conversion settings: unchanged mobility and unchanged settings still produce the same calculated value.
Export mobility in m²/(V·s) and zeta potential in mV. Retain the model, dynamic viscosity in Pa·s, and either absolute permittivity in F/m or clearly identified relative permittivity. Check instrument and cell suitability across the chosen concentrations. Malvern Panalytical’s method-development guidance explains that optical properties, particle size, and measurement configuration affect the usable concentration range.
Run a Paired Comparison
Use aliquots from the same representative dispersion. PTI’s liquid-phase testing guidance explains why liquid chemistry, solids concentration, and preparation history belong in the test definition. Apply those controls as follows:
- Prepare water and characterized-medium series at corresponding solids concentrations. Define dilution ratio explicitly, such as final volume divided by stock-aliquot volume.
- Record electrolyte identity and concentration, dispersant concentration and basis, pH, conductivity in mS/cm, temperature in °C, mixing history, and equilibration time in minutes.
- Use comparable elapsed times and measurement settings. Retain replicate mobility, calculated zeta potential, and instrument quality indicators at each concentration.
Let the Pattern Choose the Next Action
If mobility changes systematically in water but remains consistent in the characterized medium, that pattern supports a medium-dependent contribution after checking liquid properties, including viscosity, and measurement suitability. When the series diverge, prioritize investigating the dilution medium’s composition rather than attributing the response to a specific mechanism such as adsorption.
If both series change, check measurement suitability and sample evolution before concluding a concentration effect. If mobility agrees but zeta potential differs, compare conversion inputs and models; equal mobility does not exclude chemical changes. Choose a preparation that preserves the relevant medium and interface and produces reproducible results across a suitable concentration range. Then correlate the result with an independent response, such as particle-size evolution or settling, before making a formulation-stability decision.
Technical Basis / Sources
- International Organization for Standardization. Guidelines for good practices in zeta-potential measurement. ISO/TR 19997:2018. First edition, September 2018.
- Malvern Panalytical. How Do I Dilute My Samples For Zeta Potential Measurements? Manufacturer FAQ. n.d.
- Malvern Panalytical. Zeta potential method development. Technical note, September 15, 2022.
- International Organization for Standardization. Colloidal systems — Methods for zeta-potential determination — Part 2: Optical methods. ISO 13099-2:2025. Second edition, August 2025.