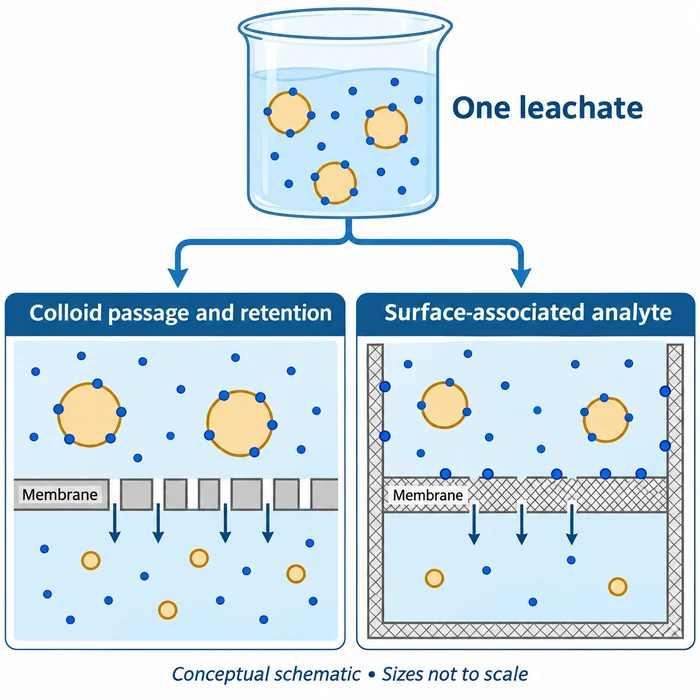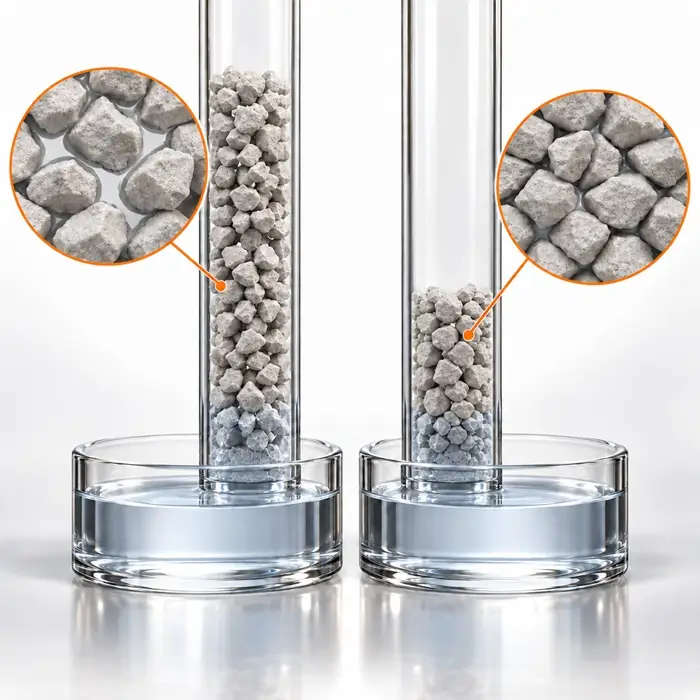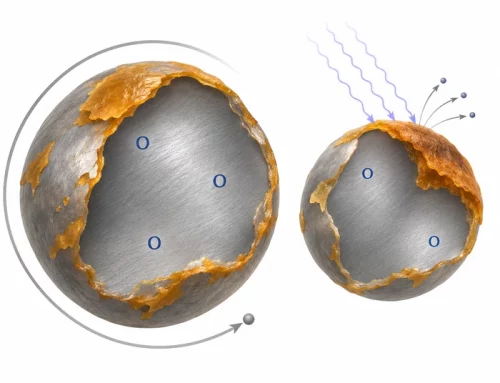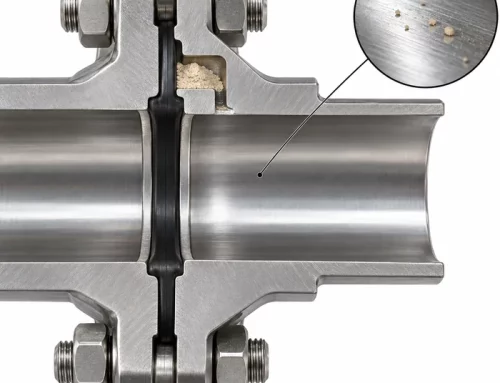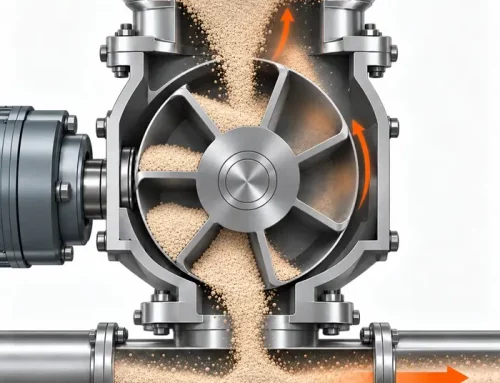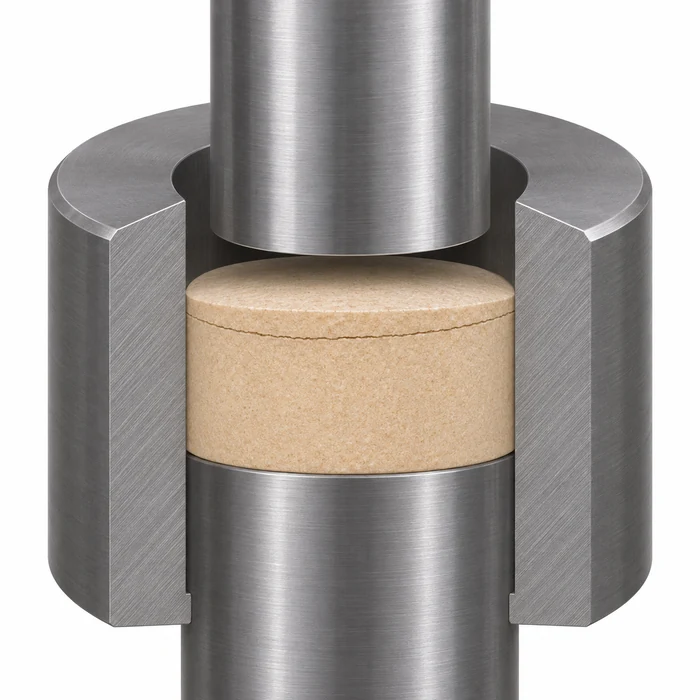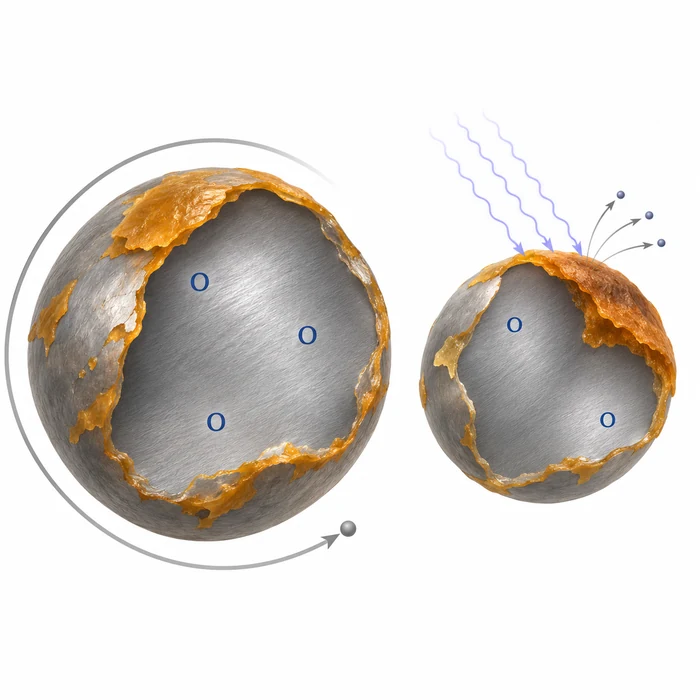
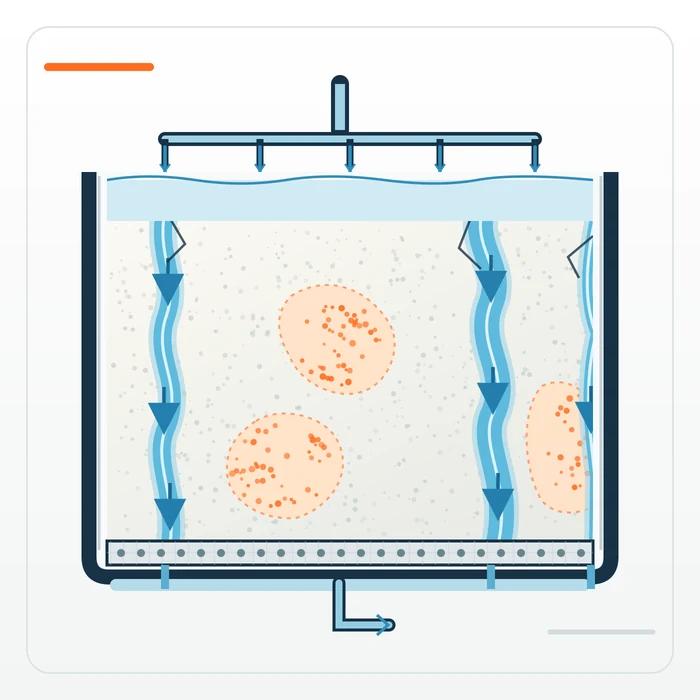
Preferential wash-liquid pathways can leave impurity in poorly contacted regions. Schematic illustration; not experimental data.
A washed filter cake fails its residual-impurity specification, so the next batch gets another wash volume. The cake improves a little, or not at all, while filtration time, solvent use, and product loss all go up. The instinct is reasonable: if washing removes impurity, more washing should remove more. However, the washing curve tells a more complicated story. Past a certain point, each additional liter of wash liquid removes progressively less impurity because the controlling transport mechanisms have changed.
The practical consequence is that adding another wash volume is not necessarily a fix. Before increasing solvent consumption, engineers need to establish which washing regime the cake has reached and where the remaining impurity actually sits.
The washing curve has three regimes
Filter-cake washing is commonly evaluated with a washing curve. It plots the impurity concentration in the wash filtrate relative to its initial concentration, c/c₀, against the wash ratio W. In its conventional volumetric form, W is the volume of wash liquid added divided by the cake pore volume.
Wilkens and Peuker describe three characteristic regimes in a real washing curve [1].
- Displacement. The wash liquid pushes mother liquor out of the pores in something approaching plug flow. Consequently, the outlet concentration initially remains close to the mother-liquor concentration while impurity removal is efficient.
- Interstitial. The displacement front breaks through. Wash liquid and mother liquor mix within the pore network, causing the outlet concentration to fall rapidly.
- Diffusion. Impurity remaining in poorly accessible regions, including stagnant pores and agglomerate interiors, transfers slowly into the flowing wash liquid. The washing curve develops a long tail, where each additional wash volume generally removes less impurity.
These names describe characteristic washing regimes, not three completely separate transport mechanisms. For example, Ruslim and co-workers found that mechanical axial dispersion dominated mass transfer under the high-Péclet-number conditions of their experiments [2]. Therefore, molecular diffusion is not necessarily the only mechanism governing the late wash. Dispersion, channeling, and mass transfer from stagnant regions can also influence the tail.
The displacement regime can end relatively early. In experiments on a hydrophilic filter cake, Wilkens and Peuker observed the end of displacement at washing ratios of 0.81 with methanol as the mother liquid and 0.96 with water [1]. However, these flushing experiments used a mass-based washing ratio, defined as the mass of wash liquid added relative to the initial mass of mother liquid in the cake pores. The reported values must therefore not be interpreted directly as equivalent pore volumes.
Moreover, the cake structures differed between the two liquid systems. The results demonstrate that the displacement regime can end at a relatively low washing ratio, but they do not establish universal transition thresholds.
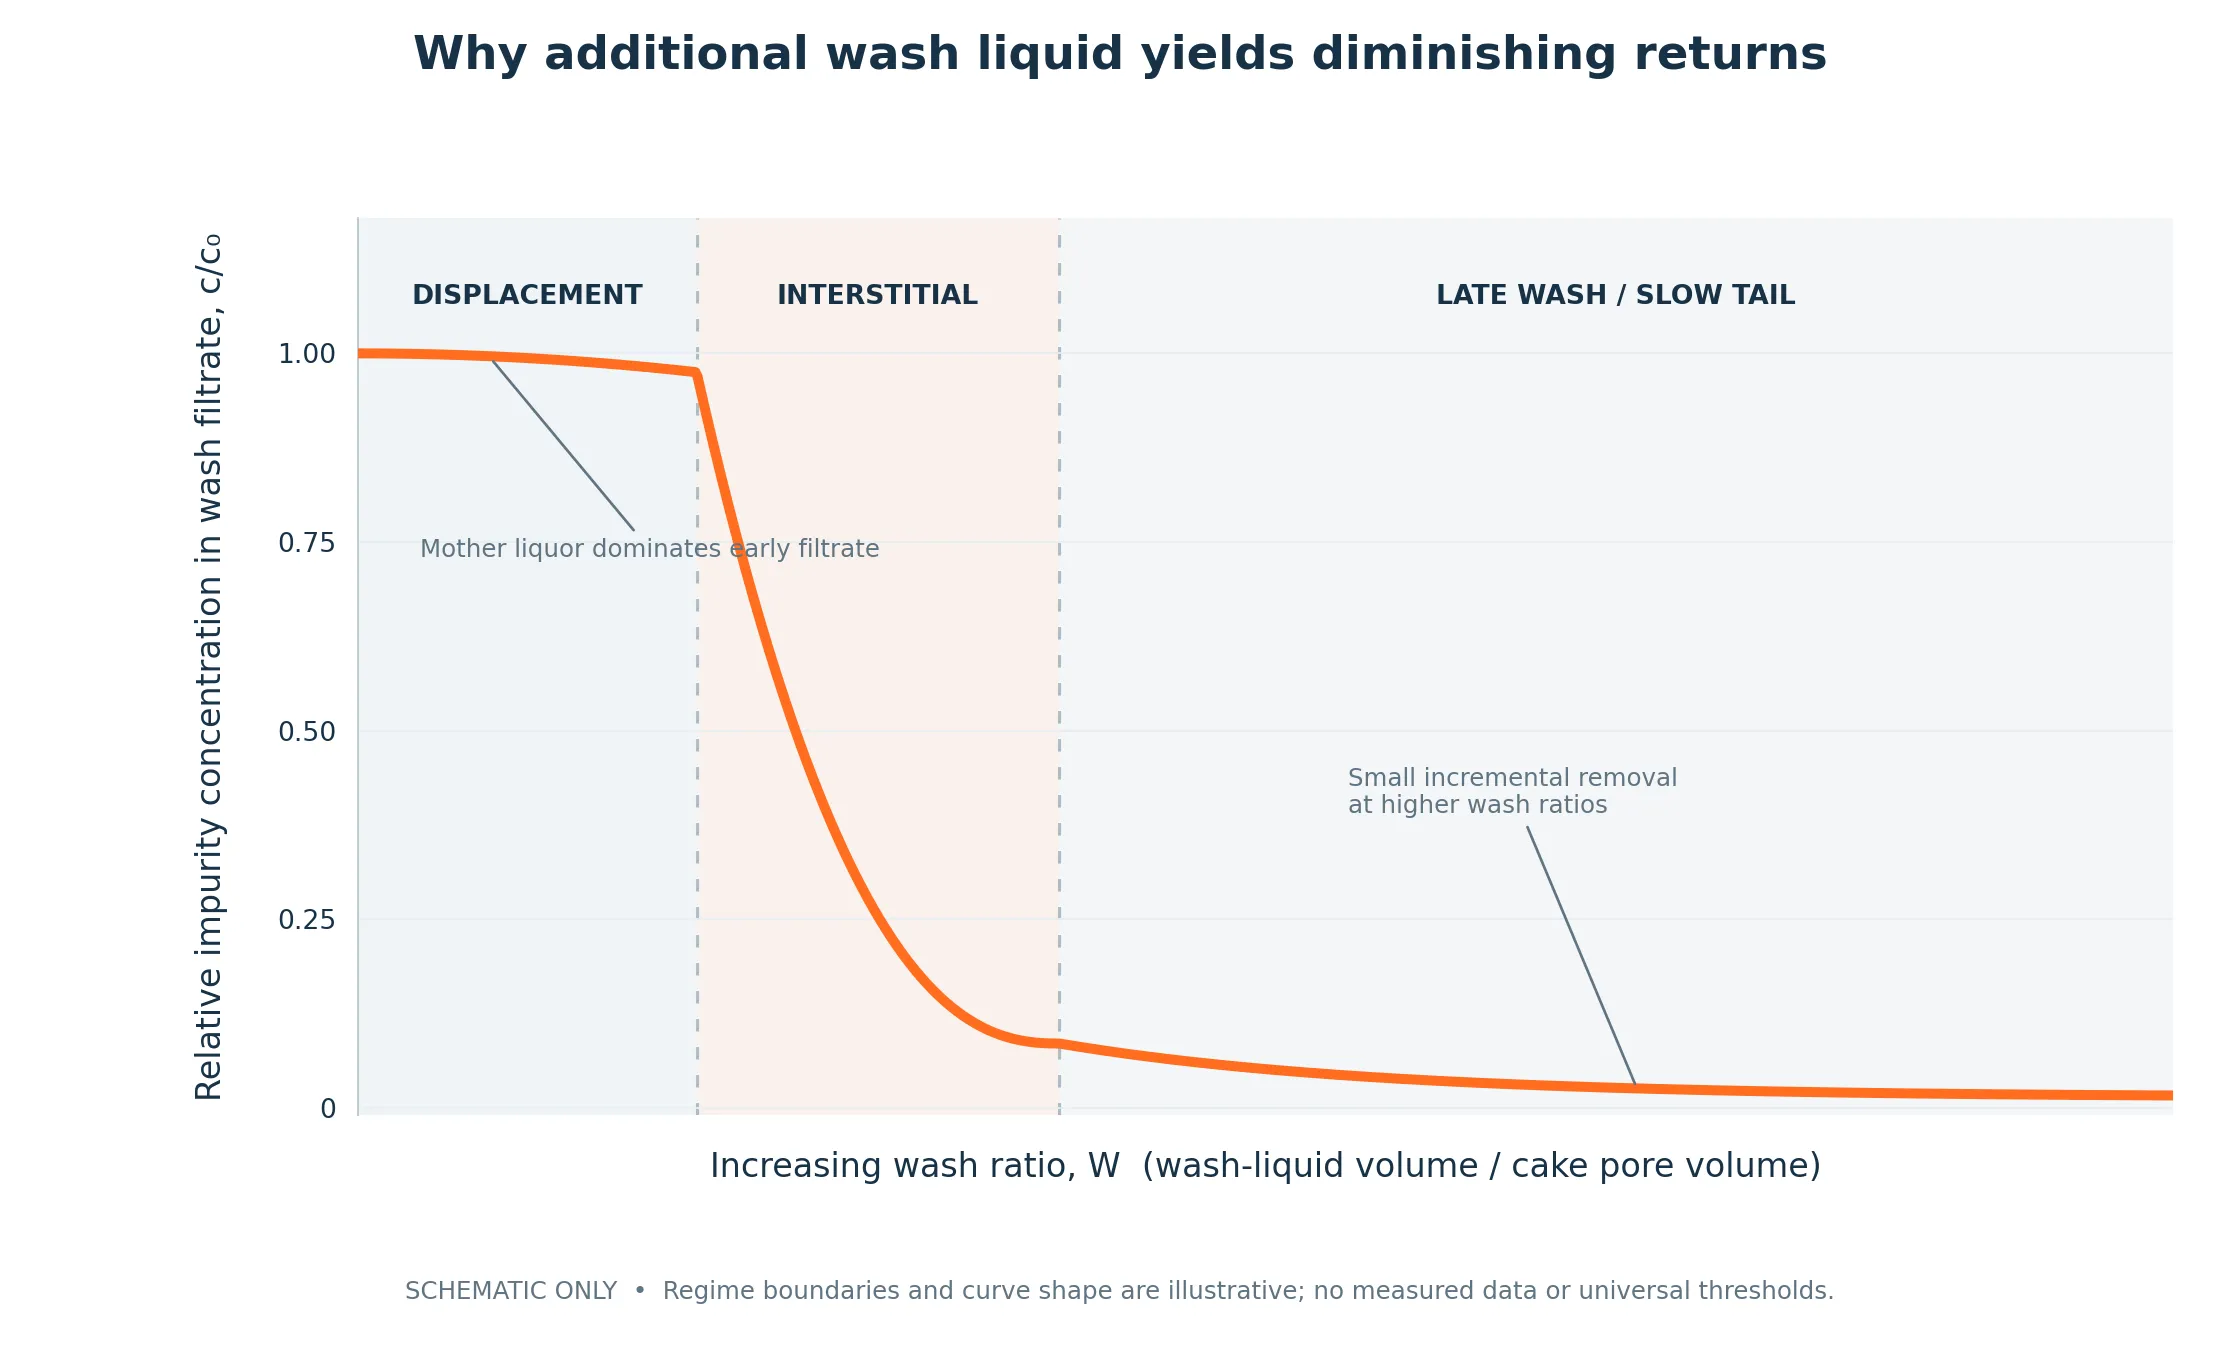
Figure 1. Illustrative washing curve showing displacement, interstitial and late-wash regimes. Curve shape and regime boundaries are schematic, not measured results or universal thresholds.
Where the extra wash liquid actually goes
Efficient displacement washing depends on reasonably uniform distribution of wash liquid through the cake. When that distribution breaks down, increasing the volume may accomplish surprisingly little. Three conditions are particularly important.
Partial deliquoring before washing. A cake that has been blown down before washing is no longer fully saturated. Ruslim et al. investigated cakes made from glass beads that had been pre-dewatered to a saturation of 0.18. At low washing flow rates, the wash liquid followed restricted pathways, leaving other regions poorly contacted. Increasing the washing flow rate improved rewetting and washing performance under those experimental conditions [2].
Poor wetting. When the wash liquid wets the solid poorly, penetration into the pore network may become uneven. Wilkens and Peuker demonstrated that surface-energy interactions influence washing quality. Better wetting can improve the exchange between mother liquor and wash liquid [1].
Cake defects. Cracks, wall detachment, and uneven cake thickness create low-resistance flow paths. Wash liquid can preferentially pass through these regions instead of contacting the surrounding material.
In each situation, additional wash liquid may continue flowing through preferential paths while significant impurity remains elsewhere in the cake. More volume then produces little improvement because it does not correct the underlying distribution problem.
Why the filtrate can look better than the cake is
The washing curve measures what leaves the cake, not necessarily what remains inside it. A falling outlet concentration can indicate two very different situations:
- A genuinely clean cake. Wash liquid has contacted most of the bed, and only a small residual impurity inventory remains.
- A cake containing clean channels and contaminated stagnant regions. Wash liquid exits through preferential pathways at low impurity concentration, while poorly contacted regions retain significant impurity.
The effluent concentration alone may not distinguish these conditions. Therefore, a process that shows a low final wash-filtrate concentration can still produce a cake that fails its residual-impurity specification. Direct measurement of the washed cake is essential when the final product quality is uncertain.
Washing has a price beyond solvent
Additional washing consumes time and solvent, even when it improves impurity removal. It may also reduce product yield.
Ottoboni and co-workers developed a mechanistic model of filtration and washing for pharmaceutical compounds, including paracetamol and mefenamic acid. Their approach accounted for dissolution of both product and impurity during washing [3].
In one modelled system, the reduction in impurity concentration per additional milliliter of wash solvent diminished substantially beyond approximately 30 mL, equivalent to about four cake volumes in that particular investigation. This was a system-specific modelling result, not a general washing limit.
Nevertheless, it illustrates an important operating trade-off. Where a product is soluble in the washing liquid, further washing may continue removing impurity while simultaneously dissolving valuable product. The relevant decision is therefore not simply whether another wash improves purity. It is whether the improvement justifies the additional solvent consumption, processing time, and product loss.
What to check before adding wash volume
- Establish the washing curve and wash-start condition. Measure the outlet impurity concentration against wash ratio for a representative batch. Identify where the decline changes from rapid to slow, and document the cake saturation when washing begins. If the cake has already been deliquored, investigate whether poor rewetting contributes to the observed performance.
- Measure residual impurity in the cake itself. Sample representative locations, including the top, bottom, center, and edge of the washed cake. Express residual impurity on a consistent dry-solids basis, with a defined extraction or analytical method. Large spatial differences can indicate preferential flow or incomplete washing, although sampling variability must also be considered.
- Investigate bypass, saturation, and wetting. Inspect the cake for cracks, wall detachment, and uneven thickness. Review whether deliquoring occurs before wash-liquid addition and whether the selected liquid wets the solid adequately. Where relevant, controlled trials can assess whether changing the wash-start condition or flow rate improves distribution.
- Compare impurity removal with solvent consumption and product loss. Measure impurity and dissolved product concentrations in successive wash fractions. Combine these measurements with filtrate volumes to estimate the corresponding impurity removal and product loss. This reveals whether additional washing is delivering enough benefit to justify its cost.
- Change the washing strategy only when the evidence supports it. When impurity remains in poorly contacted regions, reslurry washing may provide better liquid-solid contact and mass exchange than further displacement washing. However, reslurrying can increase solvent use and create additional filtration or handling requirements. Its benefit must be demonstrated for the actual material and process.
Frequently Asked Questions
Technical Basis / Sources
- Wilkens, M., and Peuker, U. A. (2011). The Influence of Surface Energy on the Washing Quality of Filter Cakes. Advances in Chemical Engineering and Science, 1, 252–255. DOI. Full text.
- Ruslim, F., Nirschl, H., Stahl, W., and Carvin, P. (2007). Optimization of the wash liquor flow rate to improve washing of pre-deliquored filter cakes. Chemical Engineering Science, 62, 3951–3961. DOI. Open access.
- Ottoboni, S., Mehta, B. A., Gramadnikova, E., Brown, C. J., and Mitchell, N. A. (2022). Impurity removal during filtration and washing: a mechanistic modelling approach. 13th World Filtration Congress, San Diego. Open access PDF.