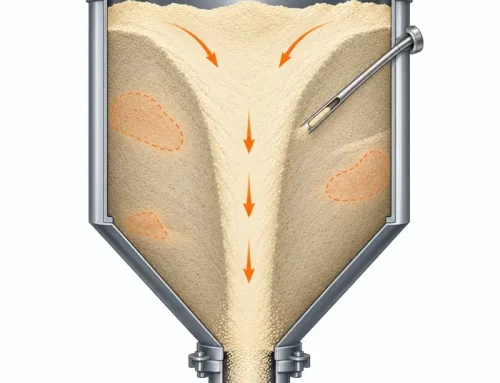

An increase in wafer microscratches does not always coincide with a change in the incoming slurry specification. D50, D90, solids concentration, and pH may all remain within their established limits, even when the abrasive population reaching the polishing pad has changed.
For colloidal silica and ceria slurries, the discrepancy can arise from a small number of oversized particles among the much larger population of primary abrasives. These may be agglomerates formed during slurry handling or contaminants introduced along the delivery system. Once trapped between the pad and wafer, a sufficiently large particle can concentrate mechanical stress and damage the surface rather than contribute to uniform material removal.
Large particles are only one potential source of scratches; pad condition, conditioning debris, and polishing parameters also influence defect formation. Nevertheless, the oversize population is an important variable that conventional bulk particle size statistics may fail to reveal.
Why a Stable D50 Can Conceal Oversized Particles
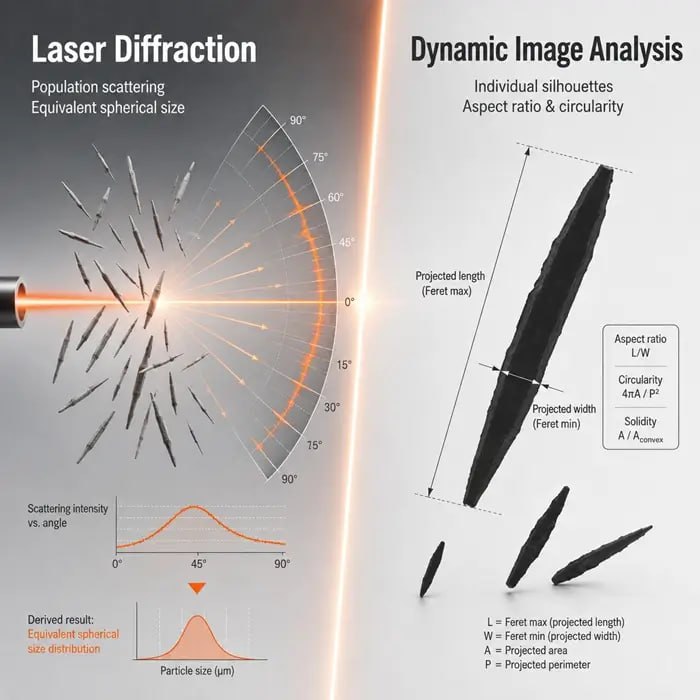
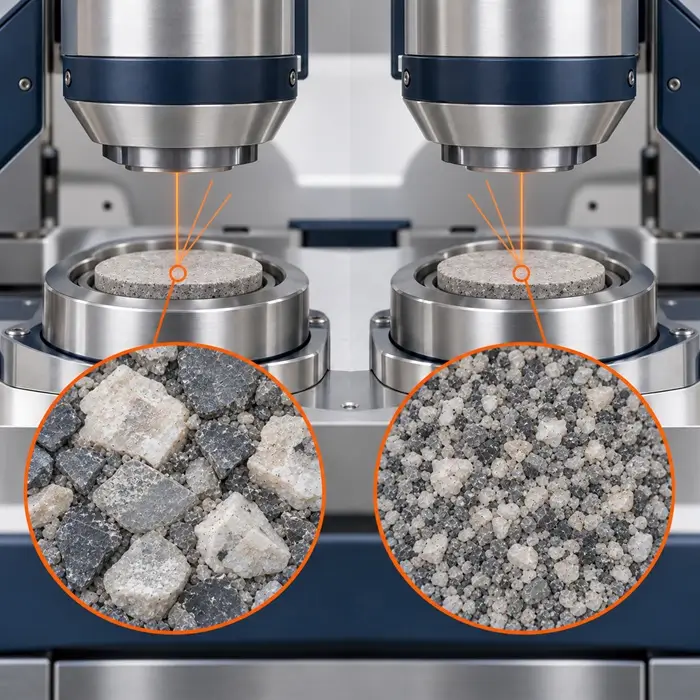
Laser diffraction generally reports a volume-based particle size distribution, with D50 and D90 representing the diameters below which 50% and 90% of the reported particle volume lie.
Both values are useful for monitoring the main abrasive population. Neither establishes how many rare oversized particles are present, particularly when their total contribution to the distribution falls below the method’s practical detection capability.
The difference between particle number and particle volume is substantial. Because volume scales with the cube of diameter, a spherical 5 µm particle occupies approximately 37,000 times the volume of a 150 nm sphere.
Putting the concentration into perspective
Consider an illustrative aqueous slurry containing 5 wt% solid silica particles, each 150 nm in diameter. Assuming a slurry density close to 1 g/mL and a silica density of 2.2 g/cm³, the slurry contains approximately 1.3 × 10¹³ primary particles per milliliter.
Now introduce 1,000 oversized particles per milliliter, each with an equivalent geometric diameter of 5 µm.
Their number fraction is only 7.8 × 10⁻¹¹, while their combined geometric volume represents approximately 2.9 ppm of the total particle volume.
| Parameter | Illustrative value |
|---|---|
| Silica solids concentration | 5 wt% |
| Primary particle diameter | 150 nm |
| Primary particle concentration | 1.3 × 10¹³/mL |
| Oversized particle diameter | 5 µm |
| Oversized particle concentration | 1,000/mL |
| Oversize number fraction | 7.8 × 10⁻¹¹ |
| Oversize geometric volume fraction | 2.9 ppm |
This calculation assumes solid silica spheres. Actual agglomerates can be porous or irregularly shaped, so their physical and optical behavior will differ from the idealized example.
At this concentration, the oversized population contributes almost nothing to D50 or D90, and detecting such a dilute tail through conventional ensemble laser diffraction would be extremely difficult. A stable bulk PSD therefore provides little assurance that the scratch-relevant population has remained unchanged.
For more on the interpretation of particle size percentiles, see PTI’s guide to D10, D50, and D90.
How Agglomerates Develop During Slurry Handling
Maintaining a stable colloidal silica or ceria slurry depends on the forces acting between suspended particles. Electrostatic repulsion and, where applicable, steric stabilization help prevent particles from coming together, but their effectiveness changes with the surrounding chemistry.
A change in pH or ionic strength can weaken those interactions. Additives and dilution conditions also matter, particularly when a slurry formulated for one chemical environment encounters another during processing.
Pumping and recirculation introduce mechanical stresses that encourage particle collisions. Whether those collisions lead to persistent agglomerates depends strongly on the stability of the dispersion.
When slurry chemistry meets mechanical stress
This interaction between chemistry and handling was examined by Chang and colleagues in 2011. They circulated 5 wt% silica slurries containing 30 nm primary particles at pH 2, 7, and 11, with and without 0.1 M KCl, over 1,000 slurry turnovers.
The experiments showed that salt addition reduced the maximum repulsive force between particles and shortened the separation distance at which attraction became important. The resulting changes in agglomeration behavior were examined in relation to particle-induced defects during polishing of low-k dielectric materials.
The results connect interparticle forces with the slurry’s response to mechanical stress.
A more pronounced example appears in Crawford et al.’s 2013 investigation of shear thickening. Working with a 25 wt% fumed silica slurry containing 0.15 M KCl, they observed an approximately fivefold viscosity increase as shear rate rose. The slurry continued thickening as the shear rate was reduced to zero, eventually reaching roughly 100 times its initial viscosity.
The change was accompanied by an increased population of particles at least 300 nm in size. When used for polishing, the shear-thickened slurry produced up to seven times more scratches than the non-thickened material.
These were deliberately demanding experimental conditions, not a representation of normal operation for every commercial CMP slurry. They nevertheless demonstrate that the particle population entering a process need not remain unchanged during mechanical handling.
In an operating delivery system, comparing samples taken before and after recirculation, filtration, and final delivery can help determine whether the oversize population is already present in the incoming slurry or develops farther downstream.
Choosing the Right Measurement for the Particle Population
<p>Characterizing the main abrasive population and quantifying rare oversized particles require different analytical approaches.</p>
| Technique | Primary application | Principal limitation |
|---|---|---|
| Dynamic light scattering (DLS) | Nanoscale hydrodynamic particle size | Strong response to larger scatterers and limited multimodal resolution |
| Laser diffraction | Bulk volume-based PSD | Limited sensitivity to extremely dilute oversize populations |
| Single particle optical sizing (SPOS) | Individual particle sizing and large-particle counting | Sensor response, dilution, inspected volume, and counting uncertainty |
| Microscopy or imaging | Particle morphology and possible agglomeration | Limited sample coverage for rare particles |
| Wafer inspection | Surface defects after polishing | Does not independently establish the defect source |
Laser diffraction remains useful when the abrasive population falls within the instrument’s validated range. ISO 13320:2020 gives an approximate application range beginning at 0.1 µm, with measurements below this requiring special instrumentation and conditions.
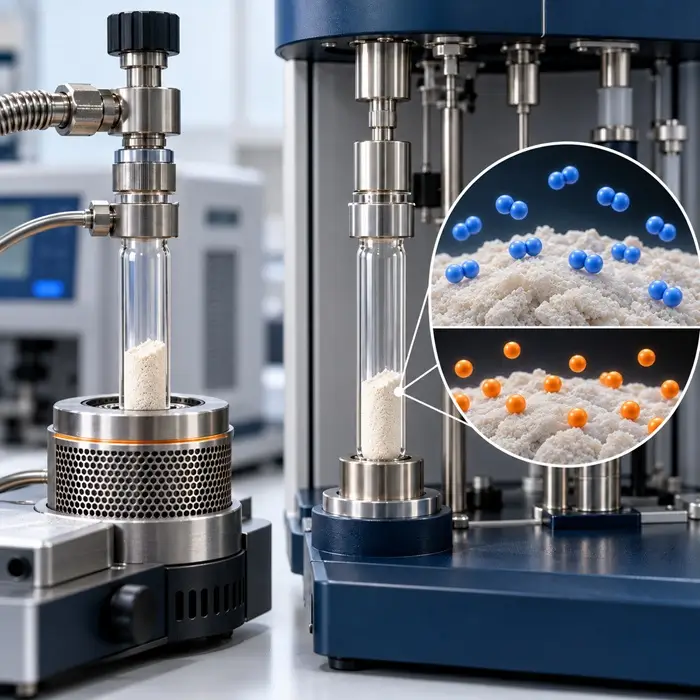
For nanoscale CMP abrasives, DLS or other complementary techniques may provide more appropriate information about the primary population.
What the SPOS sensor actually measures
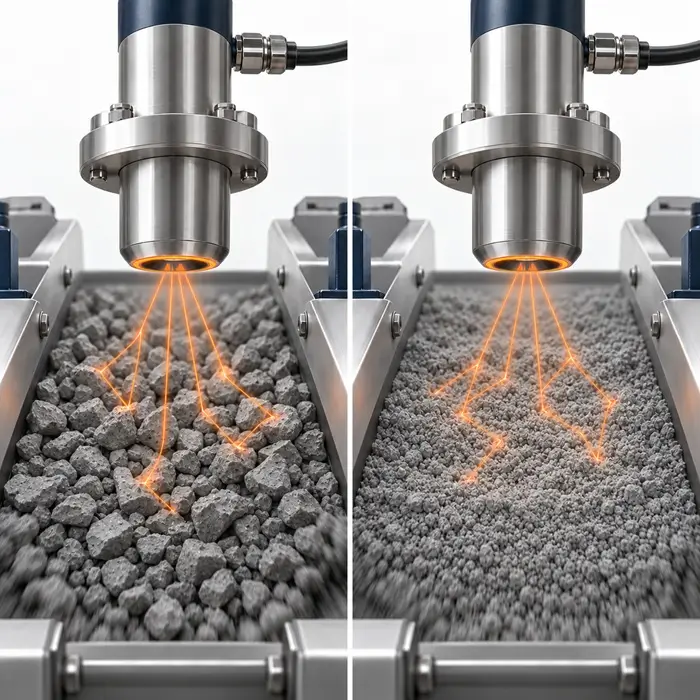
Single particle optical sizing (SPOS) measures individual particles as they pass through an optical sensing region. Instruments such as the AccuSizer use light extinction, light scattering, or both, depending on their sensor configuration.
This distinction matters when interpreting particle counts. Entegris’ LE400 sensor uses a collimated optical beam and inspects the full flow cell, while its focused-beam FX sensor relies on light extinction and interrogates only part of the liquid passing through the sensor.
The FX configuration is particularly relevant to concentrated slurries, where examining a smaller portion of the flow helps manage the optical challenges created by the high particle concentration.
It also means that the volume pumped through the sensor cannot automatically be treated as the volume optically inspected. The reported concentration depends on the validated sensor response and its correction method, as described in Entegris’ AccuSizer sensor documentation.
The applicable optical counter standards are ISO 21501-2:2019 for light-scattering liquid-borne counters and ISO 21501-3:2019 for light-extinction liquid-borne counters. They address instrument calibration and performance verification rather than setting CMP-specific particle-count limits.
Linking SPOS results to wafer scratches
The relationship between large-particle counts and wafer defects was investigated directly by Remsen and colleagues in 2006.
Using fumed silica CMP slurries, they compared static light scattering, capillary hydrodynamic fractionation (CHDF), and dual-sensor SPOS. The measured particle populations were then related to scratch counts on polished SiO₂ films, determined using dark-field optical microscopy.
The researchers found linear correlations between large-particle counts and wafer scratches. In their system, particles with silica sphere-equivalent optical diameters greater than 0.68 µm were associated with the measured scratching, with dual-sensor SPOS providing a particularly useful characterization of this population.
The correlation was measurable, but its precision was limited by experimental uncertainty. At the 95% confidence level, the researchers calculated a minimum difference of 1.8 × 10⁵ particles per gram of slurry needed to distinguish predicted scratch counts statistically under their experimental conditions.
The study demonstrates both the value and the limitations of relating large-particle measurements to wafer defects. The relevant size threshold and the concentration difference needed for a meaningful process decision depend on the slurry, the polishing system, and the uncertainty of the measurements.
Why Sampling and Dilution Can Distort Large-Particle Counts
High primary particle concentrations can make direct optical counting impractical. Dilution reduces turbidity and particle coincidence, but it also determines how much original slurry the measurement represents.
This is especially relevant when the oversize population is rare.
In a 2020 Scientific Reports study, Lee and colleagues examined inherent fluctuations in large-particle counting for semiconductor slurries. They showed how Poisson statistics limit measurement precision when relatively few events are detected.
Lee and colleagues note that some routine measurements represent only tens of microliters of original slurry. Their own reported experimental procedure used 15 mL of diluted slurry at a 60-fold dilution, equivalent to 0.25 mL of original material before accounting for instrument-specific optical sampling.
A worked SPOS counting example
Suppose an illustrative slurry contains 1,000 detectable oversized particles per milliliter and the measurement effectively examines 30 µL of original slurry after dilution and sensor-volume considerations.
The expected count is:
1,000 particles/mL × 0.030 mL = 30 particles
For independent particle events following Poisson statistics, the relative standard deviation is approximately:
RSD = 1 / √30 = 18.3%
| Effective original-slurry volume | Expected events | Counting RSD |
|---|---|---|
| 20 µL | 20 | 22.4% |
| 30 µL | 30 | 18.3% |
| 50 µL | 50 | 14.1% |
These values describe an idealized counting process, assuming complete detection of the selected particle population within the effective observation volume.
For a focused-beam SPOS sensor, that observation volume must be determined using the validated instrument response. Dividing the volume of diluted slurry passing through the instrument by the dilution factor is insufficient if only part of the flow is optically interrogated.
Even with a properly functioning counter, 30 detected events produce substantial statistical variation. Differences in sample handling, instrument response, or dilution can add further uncertainty.
Dilution creates another complication because it changes the liquid surrounding the abrasive particles. A diluent with a different pH or ionic strength may destabilize the dispersion or break apart weakly bound agglomerates, so the measured population may no longer reflect the original slurry.
Checklist: large-particle counting you can trust
- Homogenize before sampling. Use a consistent, validated procedure to redistribute settled particles without changing the agglomerate population. Lee et al. observed lower counts above approximately 1.1 µm after three weeks of storage, consistent with larger particles settling in the sampling bottle.
- Control the diluent and dilution ratio. Use a defined diluent and record its pH and relevant chemical conditions. A change in pH or ionic strength can create or disrupt agglomerates before measurement.
- Specify the sensor and size thresholds. Report counts at fixed thresholds within the instrument’s validated range, and retain the same sensor configuration for trend comparisons.
- Determine the effective sample volume. Account for dilution and the volume actually inspected. For focused-beam sensors, use the validated sensor response rather than assuming that all flowing liquid is interrogated.
- Count enough particle events. Approximately 100 independent detected events correspond to a Poisson RSD of 10%; at 25 events, this increases to 20%.
- Repeat measurements to establish repeatability. Where practical, perform at least three replicates under consistent conditions. Replicates help identify sampling variability and drift, while the total number of detected events determines the ideal Poisson counting precision.
- Compare matched sampling locations. Sample the drum or tote, downstream of recirculation, after filtration, and at point of use, with consistent handling and preparation.
- Trend results and investigate excursions. Compare counts against established measurement variation and qualified process limits. Confirm unexpected changes promptly and investigate results exceeding validated action limits.
Filtration: Removing Oversize Without Compromising Polishing
In a bench-scale study representing slurry delivery and point-of-use filtration, presented at the 2019 IEEE Advanced Semiconductor Manufacturing Conference, improved slurry delivery filtration reduced counts above 0.5 µm by approximately 60%. Adding point-of-use filtration increased the reported reduction to around 80–90%.
Those figures describe measured large-particle removal. Whether an equivalent improvement appears in wafer defectivity depends on the process, and filtration can also affect the useful abrasive population.
The polishing tradeoff in ceria slurry filtration
That tradeoff was examined by Oh and colleagues in 2024, who compared depth filtration with membrane surface filtration for ceria CMP slurry.
Their surface filtration setup used tangential-flow filtration (TFF), in which slurry moves along the membrane while a portion of the liquid passes through it. This crossflow arrangement helps control the accumulation of retained material at the surface, making it different from a conventional dead-end point-of-use cartridge.
A 200 nm membrane gave the researchers the required large-particle removal without substantial loss of active abrasive particles under the tested conditions. They selected a flow rate of 0.8 L/min after assessing filtration productivity and particle behavior.
With that configuration, wafer uniformity improved by 17.11%. The improvement came alongside a maximum reduction in material removal rate of 272.54 Å/min (27.25 nm/min), associated with lower removal near the wafer edge.
The experiment illustrates why choosing a filter solely on the basis of its nominal pore rating can lead to the wrong process decision. A 200 nm membrane operating in TFF mode behaves differently from a dead-end cartridge of the same nominal rating, and greater particle removal is not necessarily better if it alters abrasive performance.
For an operating CMP system, filter qualification should therefore consider upstream and downstream large-particle counts together with abrasive retention, filtration throughput, and wafer inspection results. Differential pressure provides useful supporting information, but changes in pressure can reflect ordinary filter loading or slurry-property changes as well as the accumulation of oversized material.
Measurements also need to extend downstream of the filter. A low large-particle count immediately after filtration does not rule out agglomeration or contamination closer to the polishing head.
Using Large-Particle Counts to Investigate Scratches
Where scratching increases despite a passing bulk PSD, comparing large-particle counts at successive points in the slurry delivery system can help locate changes in the abrasive population.
The results can narrow the investigation before engineers alter the formulation or replace filtration hardware.
| Observation | Possible cause | Recommended investigation |
|---|---|---|
| Stable D50, rising large-particle count | Oversize formation or contamination | Confirm repeatability and examine threshold-channel trends |
| Counts increase after pumping | Stress-induced agglomeration or mechanical contamination | Compare matched samples and review slurry chemistry |
| Counts fall across filtration | Retention of the measured particle population | Quantify removal efficiency and check abrasive losses |
| Counts rise downstream of filtration | Downstream agglomeration or contamination | Sample progressively closer to the polishing head |
| Counts remain stable while scratches increase | Pad, conditioning, or other process-related defect mechanisms | Compare defect patterns with equipment and consumable history |
| Repeated measurements vary strongly | Sampling inconsistency or insufficient detected events | Review preparation, effective volume, and counting uncertainty |
Establishing acceptance criteria
Large-particle counts become most useful when they form part of an established process history. Consistent sampling locations, optical thresholds, and measurement procedures make it possible to recognize changes that exceed normal analytical variation.
An excursion detected after recirculation may warrant checking pump conditions and slurry chemistry, while a rise appearing only downstream of filtration points toward a different part of the system. In either case, wafer inspection provides the evidence needed to determine whether the particle-count change is associated with actual defects.
Acceptable concentrations cannot be transferred directly between different abrasives, substrates, or polishing processes. Qualified limits should reflect the specific measurement method, established process performance, and the defect sensitivity of the application.
Engineering Conclusions
When a CMP slurry passes its bulk particle size specification but scratching increases, large-particle counting provides a way to investigate what D50 and D90 cannot reveal. Combining repeatable SPOS measurements with sampling at defined process locations and wafer inspection helps identify changes in the oversize population and establish whether they are contributing to the defect problem.
Corrective actions, including filtration changes, should be judged by their effect on both particle removal and polishing performance.
FAQ: CMP Slurry Scratch Defects
Technical Basis / Sources
Chang et al. (2011), Colloids and Surfaces A: Stress-Induced Agglomeration of CMP Slurries.
Crawford et al. (2013), Colloids and Surfaces A: Shear Thickening and Defect Formation.
Lee et al. (2020), Scientific Reports: Inherent Fluctuations in Large-Particle Counting.
IEEE Advanced Semiconductor Manufacturing Conference (2019): Multi-Stage CMP Slurry Filtration.
Oh et al. (2024), Materials Science in Semiconductor Processing: Ceria Slurry Surface Filtration.
ISO 13320:2020, Particle Size Analysis by Laser Diffraction; ISO 21501-2:2019, Light Scattering; ISO 21501-3:2019, Light Extinction.