

Precision in Dispersion: The Role of Accurate Data Collection and Quality Assessment
Dispersion shapes material properties in various industries, impacting outcomes in fields like pharmaceuticals and electronics. Achieving high-quality dispersion is crucial for optimizing these results.
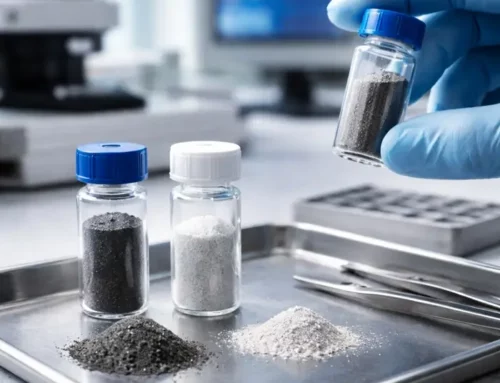
Accurate data collection forms the foundation of dispersion quality assessment. It involves measuring key parameters like particle size, distribution, Zeta potential, and concentration. Reliable measurements ensure precise analysis and interpretations. By prioritizing precise measurement techniques, researchers can maintain the integrity of the analyzed data.
Calculations for Dispersion Quality
Quantitative assessment of dispersion quality involves various calculations. Techniques like dynamic light scattering and laser diffraction help analyze particle size distribution, revealing both range and uniformity within a medium. At the same time, concentration calculations, expressed in weight or volume percentages, provide a detailed foundation for understanding the dispersion’s characteristics. Precise quantification of particle size distribution is crucial for achieving a comprehensive understanding. Grounded in light scattering principles, dynamic light scattering and laser diffraction excel at characterizing particles from the nanometer to micrometer range. As dispersed particles move due to Brownian motion, these techniques capture fluctuations in scattered light, creating a dynamic particle-size profile.
Mathematical Formulas in Particle Analysis: Insights from Dynamic Light Scattering and Laser Diffraction
Dynamic light scattering uses a mathematical representation to calculate the intensity autocorrelation function, denoted as q(τ). This function is key to analyzing particle behavior in a sample. The formula, q(τ) = 1/N ∑(i=1) Ai ⋅ cos(ωiτ + ϕi), is broken down as follows: N represents the particle count, Ai indicates particle amplitude, ωi is the angular frequency of the ith particle, and ϕi refers to the phase shift. This comprehensive formula enables detailed analysis of particle dynamics, offering insights into their characteristics and interactions within the system.
The Laser Diffraction Formula, D(h) = sin(θ) * λ, encapsulates critical parameters for particle analysis. In this formula, D(h) represents particle diameter, λ signifies the laser light wavelength, and θ indicates the scattering angle. Although simple, the formula effectively clarifies particle size based on the diffraction pattern created by laser light interacting with particles. Understanding these elements provides valuable insights into particle size analysis.
Quantitative Analysis in Particle Studies: From Dimensional Insights to Concentration Calculations
Researchers can derive precise information about particle dimensions, supporting fields from materials science to environmental monitoring.
Concentration calculations also play a crucial role in evaluating dispersion quality. These calculations offer quantitative insights into the dispersed phase's concentration within a medium. For the Weight Percentage Calculation (% w/w), the formula is:
%w/w=(Weight of dispersed phaseTotal weight of dispersion)×100% w/w = left(fracright) times 100
Similarly, the Volume Percentage Calculation (% v/v) follows:
Precision in Particle Analysis: Weight and Volume Percentage Calculations for Accurate Dispersion Monitoring
%v/v=(Volume of dispersed phaseTotal volume of dispersion)×100% v/v = left(fracright) times 100
These weight and volume percentage calculations are invaluable tools for researchers. They provide precise methods to monitor and regulate the quantity of dispersed material, ensuring accuracy across various scientific and industrial applications.
Ensuring Accurate Dispersion Analysis: The Role of Critical Sample Size and Quantitative Calculations in Particle Studies
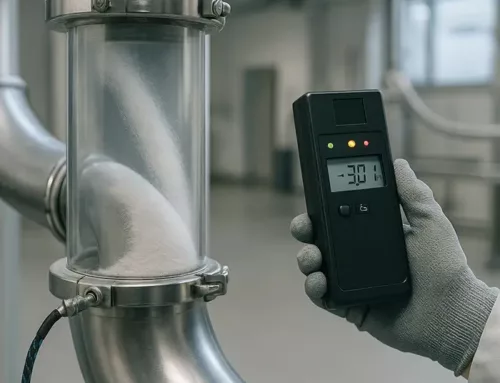
In addition to the techniques discussed, considering the critical number of test samples is vital when evaluating dispersion quality. The critical number can be calculated using a dispersion calculator, which factors in the coefficient of variation and the number of samples analyzed. This calculation ensures reliable and accurate dispersion analysis, offering valuable insights into dispersion quality.
Moreover, these calculations are essential not only for scientific research but also for industrial applications. They allow researchers and professionals to precisely monitor and regulate the quantity of dispersed material, ensuring accuracy and consistency in various processes and products.
Common Data Analysis Techniques
Navigating dispersion quality requires statistical methods for a deeper understanding of the data. In particle size analysis, the mean particle size (μ) is calculated by summing all particle sizes and dividing by the total number of particles:
μ=∑i=1NParticle SizeiNμ = frac
The standard deviation (σ) quantifies the spread of particle sizes around the mean. A smaller σ indicates a more uniform distribution:
σ=∑i=1N(Particle Sizei−μ)2Nσ = sqrt{frac}
Variance (σ²), the square of the standard deviation, captures the overall variability in a dataset:
σ2=∑i=1N(Particle Sizei−μ)2Nσ² = frac
Advanced Statistical Approaches for Dispersion Quality: From Variance Analysis to PCA and SPC
These statistical parameters provide essential insights into the consistency and quality of particle dispersions.
Variance provides valuable insights into the extent of dispersion around the mean. It plays a key role in assessing data spread and distribution, deepening our understanding of the dataset’s statistical characteristics.
Principal Component Analysis (PCA) and Statistical Process Control (SPC) are crucial in dispersion quality analysis. PCA transforms variables into uncorrelated components, revealing complex relationships within the data. On the other hand, SPC monitors processes and establishes real-time control limits for necessary adjustments. Both methodologies rely on advanced statistical software, enhancing the sophistication of dispersion quality analysis.
Beyond mean and standard deviation, effective data interpretation requires skilled pattern recognition and anomaly detection. Identifying trends and irregularities is essential for assessing the stability and reproducibility of dispersion processes.
Common Data Analysis Techniques
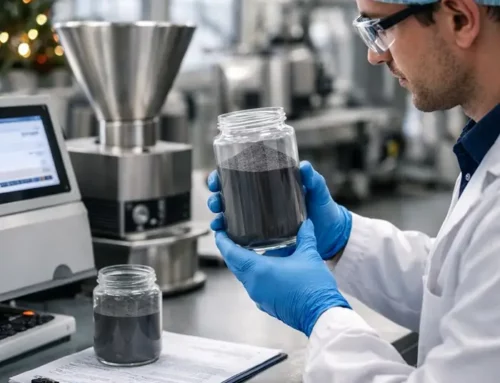
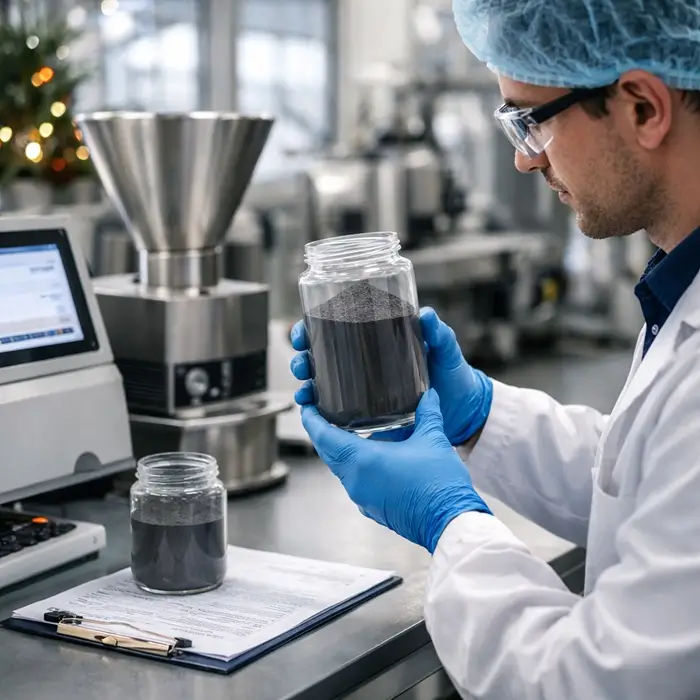
In dispersion quality assessment, integrating advanced data analysis provides a comprehensive approach that combines quantitative evaluation with qualitative insights. One key advantage of data analysis in dispersion processes is its role in troubleshooting. By identifying deviations from expected data patterns, engineers and researchers can pinpoint issues like agglomeration, inadequate mixing, or inconsistent concentration. With this information, they can implement targeted interventions to resolve problems and improve dispersion quality.
Interpretation of Dispersion Characteristics
Accurately performing specified calculations forms a solid foundation for interpreting dispersion characteristics. When techniques like dynamic light scattering or laser diffraction reveal a uniform particle size distribution, it indicates effective dispersion. This uniformity suggests that particles are evenly spread throughout the medium. However, identifying a skewed distribution signals potential issues like agglomeration or uneven mixing. Early recognition of these challenges allows for timely interventions to improve dispersion quality. Uneven mixing or agglomeration can not only affect immediate properties but also create cascading effects on downstream processes and applications.
Therefore, promptly identifying and addressing deviations from the desired uniform distribution is crucial. Doing so ensures the reliability and quality of the dispersed system across various contexts. Concentration calculations also play a key role in this interpretative process. These calculations provide insights into the quantity and consistency of the dispersed phase. By examining concentration, researchers gain a clearer understanding of overall dispersion quality and can take corrective actions as needed.
Applying mathematical rigor to these calculations turns qualitative observations into quantitative insights. This precise approach helps researchers optimize formulations by offering clear data on the concentration of dispersed material. Ultimately, combining accurate measurements with detailed analysis equips researchers to make informed decisions, improving overall dispersion effectiveness. The combination of particle size distribution analysis and concentration calculations establishes a stable foundation for comprehensive interpretation and reliable results.
Real-world Applications
In the pharmaceutical industry, achieving precise dispersion of drug particles within a solvent is paramount for optimizing bioavailability and therapeutic efficacy. Data analysis techniques, particularly focused on particle size distribution, enable researchers to fine-tune formulations. By interpreting the data, scientists can ensure that the dispersion aligns with targeted specifications, influencing factors such as dissolution rates and overall drug performance. Real-time monitoring of these parameters
Integrating Data Analysis for Effective Troubleshooting and Quality Improvement in Dispersion Processes
In dispersion quality assessment, integrating advanced data analysis provides a comprehensive approach that combines quantitative evaluation with qualitative insights. One key advantage of data analysis in dispersion processes is its role in troubleshooting. By identifying deviations from expected data patterns, engineers and researchers can pinpoint issues like agglomeration, inadequate mixing, or inconsistent concentration. With this information, they can implement targeted interventions to resolve problems and improve dispersion quality.
Leveraging Data Analysis for Precision in Material Dispersions and Enhanced Drug Delivery Systems
through data analysis facilitates adjustments in formulations, leading to enhanced drug delivery systems.
In materials science and engineering, dispersion is critical in developing advanced materials with tailored properties. The careful distribution of particles within matrices, guided by scientific principles, results in materials exhibiting enhanced mechanical properties and overall performance. Data analysis techniques aid in precisely characterizing these dispersions, allowing researchers to correlate dispersion
Optimizing Dispersion Quality: From Advanced Materials to Food Science Through Data-Driven Insights
quality with material functionality. Such insights build the designs of aerospace, automotive, and electronics materials, driving innovation and efficiency.
Even in the food industry dispersion quality is a sensory and functional cornerstone. The even distribution of flavoring agents, emulsifiers, and stabilizers within food products is a science-based art. Data analysis of concentration and particle size distribution ensures the harmonious blending of ingredients, influencing both the texture and taste of a wide array of products.

Through meticulous interpretation of this data, food scientists can consistently deliver delightful culinary experiences, from chocolate bars to carbonated beverages.
Full potential
The ability to harness the full potential of data analysis in dispersion processes not only ensures stability and uniformity but also unlocks opportunities for innovation and problem-solving. The continuous quest for perfection in dispersion, guided by data-driven insights, propels industries forward. As we navigate this intricate chemical domain, from agglomeration to irreversible aggregation, data analysis stands as the guiding light that illuminates the path toward optimal dispersion quality.
