

Sugar Flowability analysis
Sugar is present in all types of produce (fruits and vegetables) in various degrees. Sugar cane contains 12-14% sucrose and sugar beets contain 16-18% of sucrose, making them the highest in sucrose concentrate of all-natural resources. Sucrose is a disaccharide, a molecule composed of two monosaccharides, in the case of sugar glucose, and fructose. The sugar extraction process is similar for both products.
Sugar refining is a secondary process where specialty sugars are produced for various types of industry. In this article, we will briefly touch upon types of sugar and will focus primarily on commercial powdered sugar about flowability, as well as the methods used for testing.
Types of Sugars
Fine sugars: With coarse sugars primarily being used as an end product and for certain types of candies. Granulated sugar is formed by letting a saturated solution of sugar and water crystallize on a surface appropriate for crystal nucleation. Heating the water before adding sugar permits more sugar to dissolve producing larger crystals. Granulated sugar is identified by the following basic characteristics; it has a white clear crystalline structure with medium grain size from 0.5 to 1 mm, it displays Free-flowing characteristics, and it has a wide application because of its additional functional properties for foods. However, for many other food types such as baking goods, a sugar type needs to be used with a finer consistency. Powdered sugars exist in the particle size range of 10 to 30 μm and are both used as an end product as well as in candies, toppings, and other sweets or food products in general, such as tomato sauces, pastes, and more. Especially with smaller particle sizes, an anticaking agent often needs to be introduced, in some cases, a type of starch like cornstarch or Tricalcium phosphate is added. The Sugar Flowability basic characteristics of powdered sugar consist of the following aspects. It is ground granulated sugar. Generally, powdered sugar is easy to process and free-flowing, an appropriate anti-caking agent is added ensuring an optimal flowability, homogeneous in, for example, dry powder mixes.
Sugar Flowability analysis – The relationship between particle size and flowability:
Delft Solids Solutions researched the flowability of three different samples of powdered sugar with the intent to primarily address flowability and the issues that might arise when discharging from a silo or hopper. Besides external conditions such as relative humidity and temperature of the environment, many intrinsic factors influence the flowability of a powder, such as the particle size, shape, density, adhesiveness, electrostatic-changeability, and other surface conditions of the particles. In particular, particle size and shape are crucial factors affecting flowability. The small particle size of a powder tends to reduce the powder flow, as the increase in surface area per unit mass provides a greater surface area on which the surface cohesive forces can interact, resulting in a more cohesive flow.
Flowability: Cohesive materials flow “en masse” or behave as agglomerates creating several potential flow patterns that can be observed, like core flow and non-flow. The core flow pattern can also be described as ratholing or funnel flow where mainly the core is in movement, typically last in, first out.
When stress is applied to the powder, the flow properties may change drastically. This stress can occur during the filling and emptying of big bags and the emptying of a silo or hopper. The forces exerted by the powder on top of a bottom layer of product stored in a silo and the corresponding flow properties can be simulated by shear measurements.
The principle of shear testing is to measure the internal friction of a powder after exposure to different consolidation stresses. Shear stress investigations provide insight into the consolidated flow properties and they can also be used for a rational hopper design. The hopper half-angle and hopper outlet diameter can be calculated from the shear measurement in combination with the product density and wall friction of a representative hopper wall material.
Flow function
The flow function visualizes the powder flow behavior and as such can be used to compare the flow characteristics of various powders upon exposure to certain stresses.
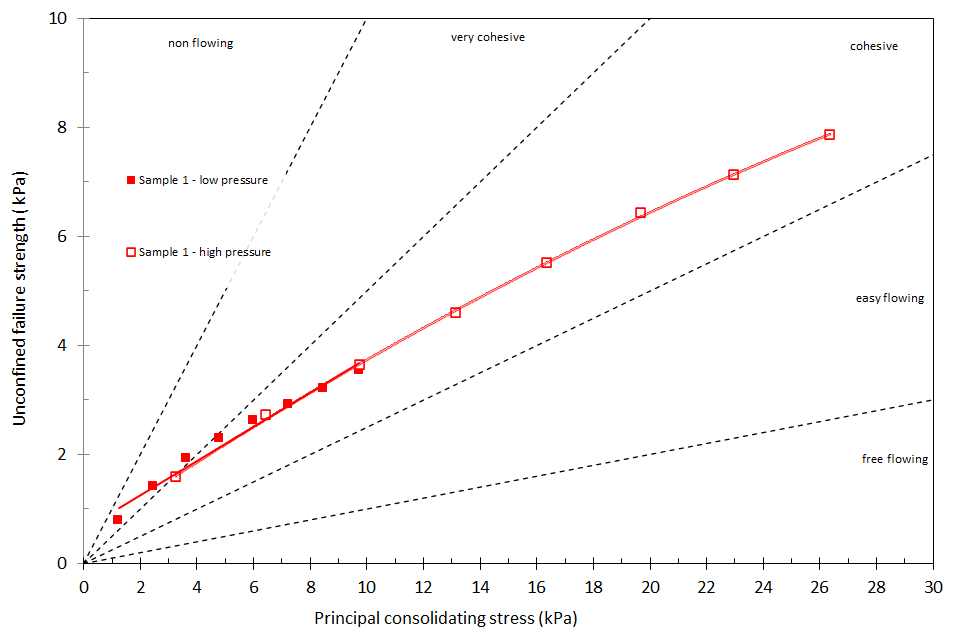
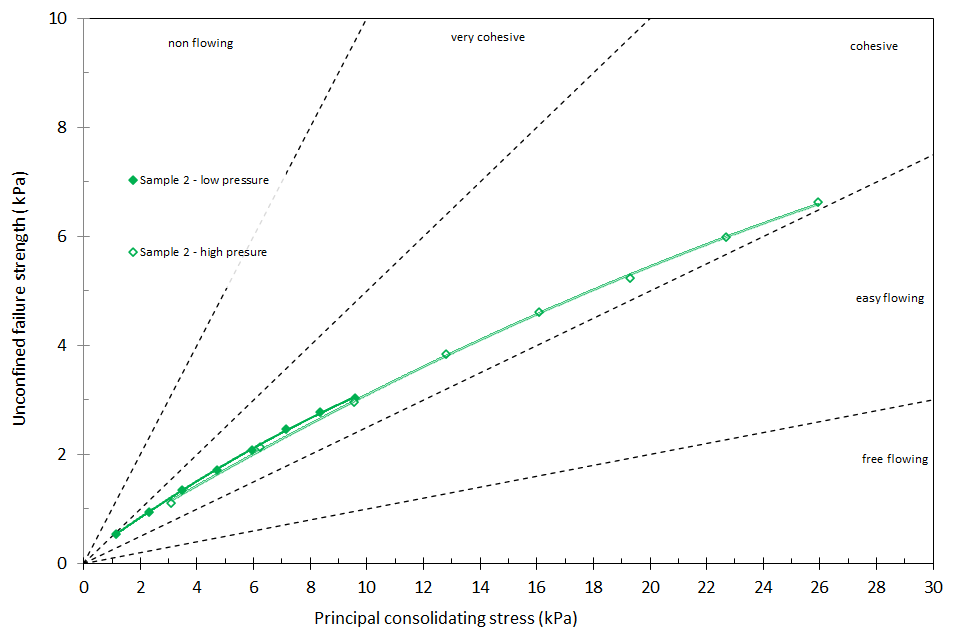
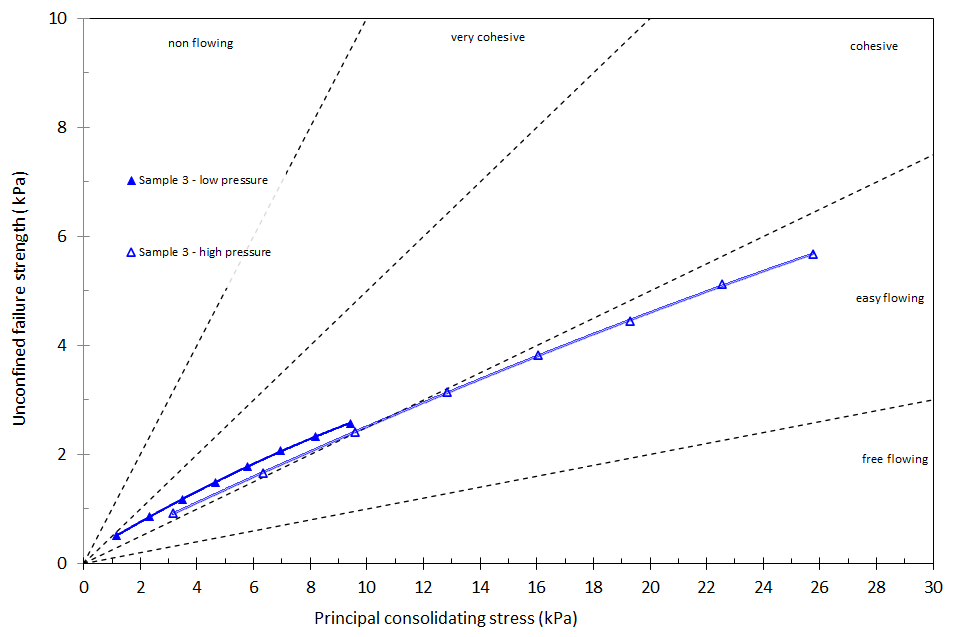
The flow function is the relation between the Unconfined Failure (Yield) Strength (kPa) and the Principle Consolidation Stress (kPa). The flow function is categorized into 5 different categories: free-flowing, easy flowing, cohesive, very cohesive, and non-flowing.
Equipment used and methodology applied
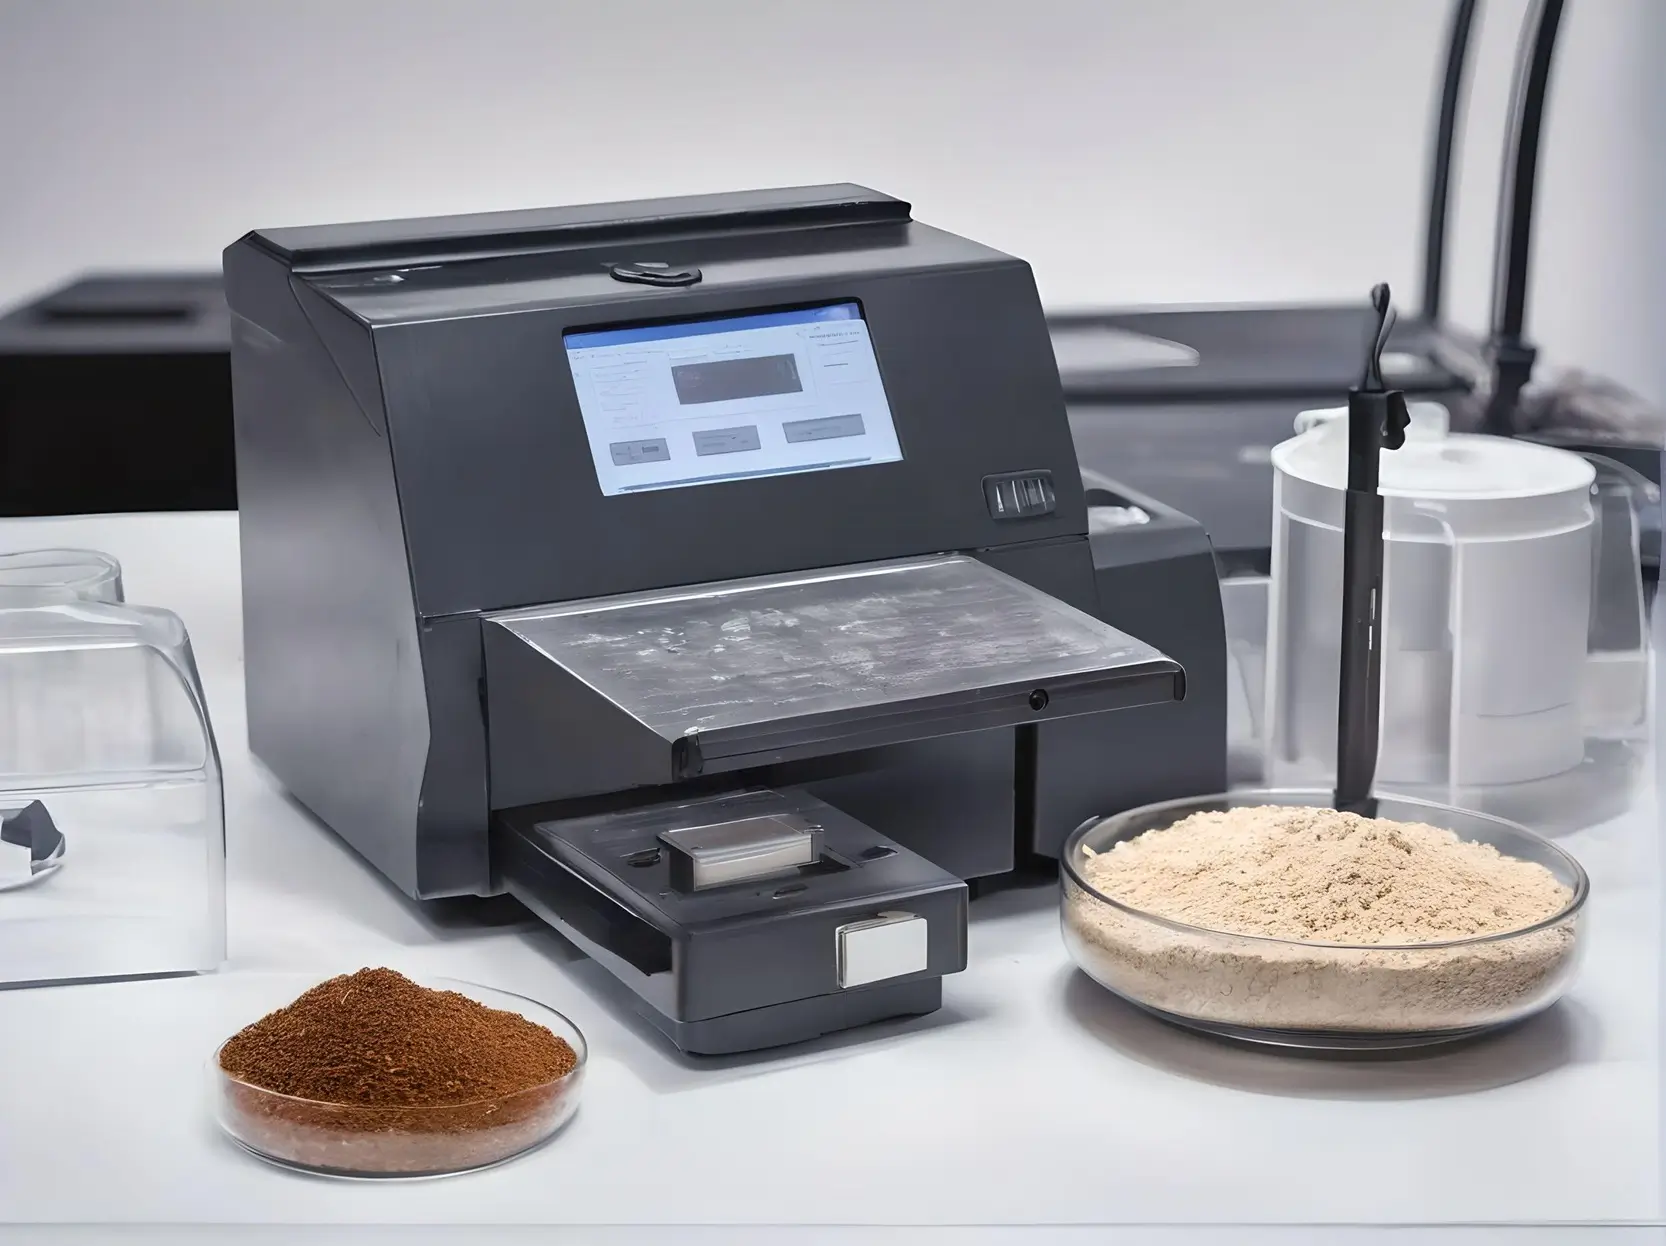
The AMETEK Brookfield powder flow tester and Anton Paar MCR Powder Rheometer have been applied for the flowability investigations. With these techniques, the powder flow characteristics can be obtained over smaller and larger sample sizes from a few grams up to several 100’s of grams. The measurements have been performed as independent duplicates where for each measurement eight different consolidation stresses have been applied.
Testing results
The flow function results of each sample are presented in figures 1 up to 3 and a comparison of the three samples is presented in figure 4.
The three samples have good repeatability, which is confirmed in figures 1 to 3, the independent measurements almost completely overlap. The high-pressure results obtained with the small sample cell are perfectly in line with the low-pressure results measured with the large sample cell. Since the low data points of the high pressure nicely overlap the high data points of the low-pressure curves. A comparative overview of the flow functions measured on the three samples is presented in figure 4.

From this figure can be concluded that Sugar Flowability analysis sample 3 shows the best flow properties and can be classified as easy flowing fol- lowed by sample 2, which is in the cohesive region, and finally, sample 1, which has the most cohesive character of these three samples. So from this, we can conclude that sample 1 will potentially display most severe flowability issues, followed by 2. The client as a result adapted the anti-caking agent of the first two samples to be more by the third sample.
How we can help you with Sugar Flowability analysis
Innovation in industry consists of the development and appropriation of new and improved products, processes, and services. Starting from the source material all the way down to the production chain. Companies are looking for ways to make a more accessible and sustainable product, both in terms of the production cycle as well as production footprint. Including research and development aspects in which we can play a role for you. Our knowledge, expertise, and laboratory infrastructure are built around particle and powder technology and can be divided into five main areas:
- (Bulk) powder behavior
- Surface and porosity properties
- Particle size and shape
- Material composition
- Powder processing
Delft Solids Solutions can help in the process of either making or optimizing materials for example by milling or mixing, as well as investigate and improve the impact of certain unit operations on processes.
